Annual Sustainability Report Design Trends 2026
Sustainability reporting has moved far beyond a formal requirement. It is now a strategic communication tool that shapes perception, builds trust, and defines how organizations position themselves in a rapidly changing world. As environmental and social responsibility become central to business strategy, the way these efforts are presented has gained equal importance. Design is no longer decorative. It is functional, persuasive, and deeply tied to how information is understood.
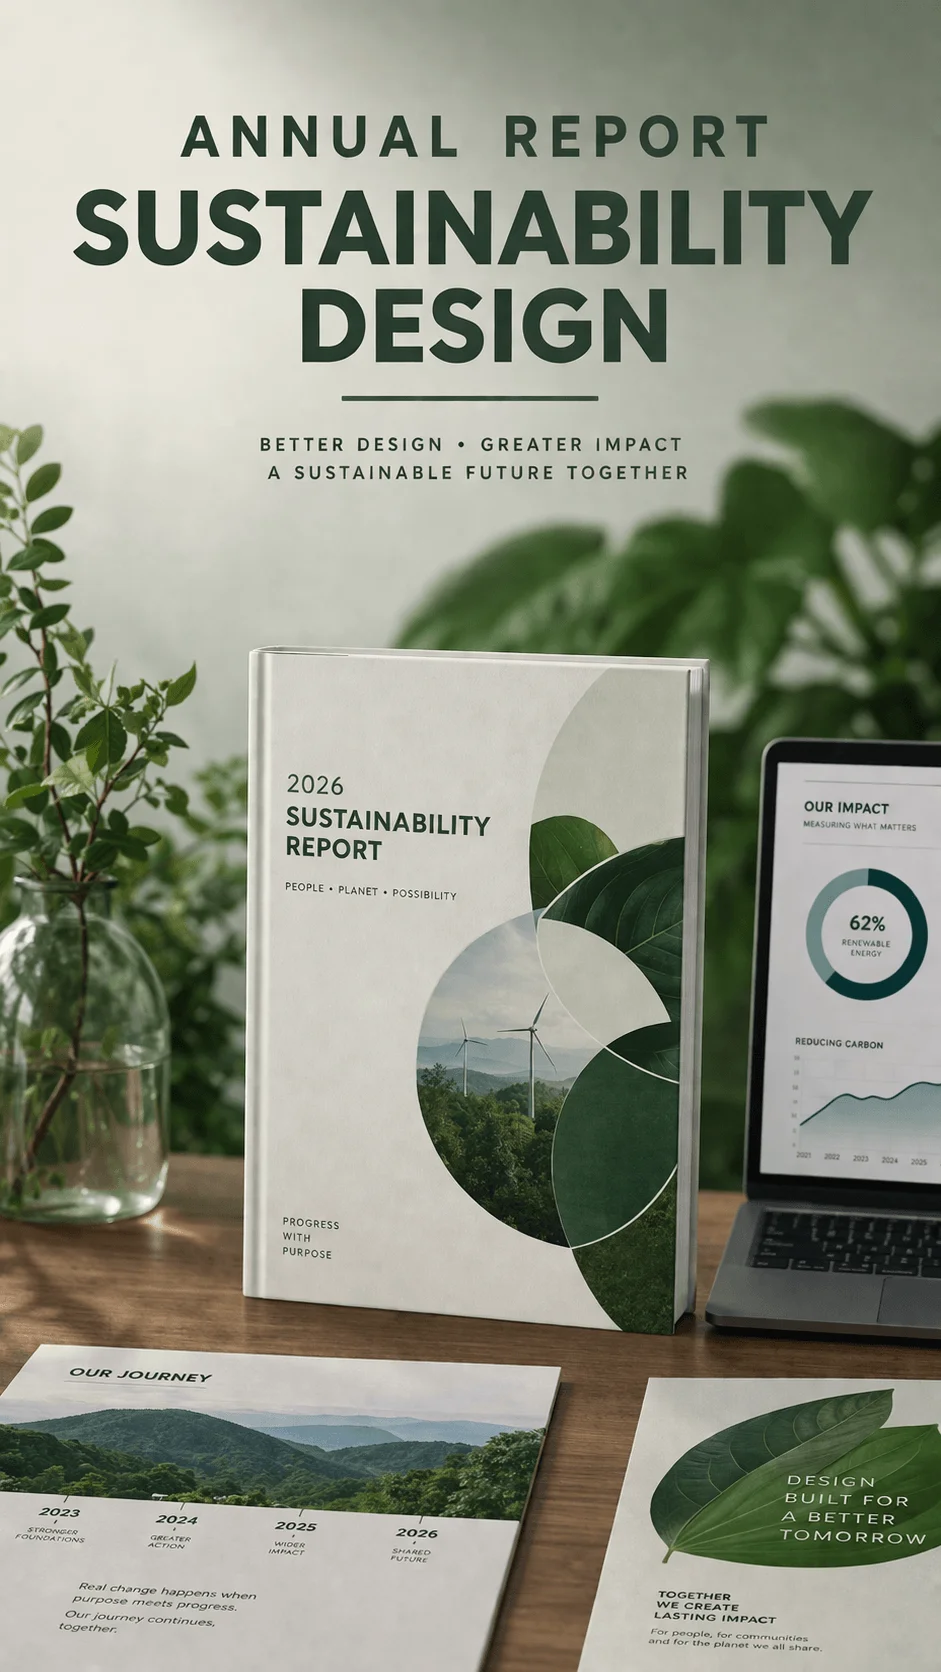
In 2026, annual sustainability report design reflects a shift in mindset. Reports are no longer static documents created once a year. They are evolving into living experiences that combine storytelling, data, and interaction. This transformation is driven by changing audience expectations, digital behavior, and the need for clarity in complex information.
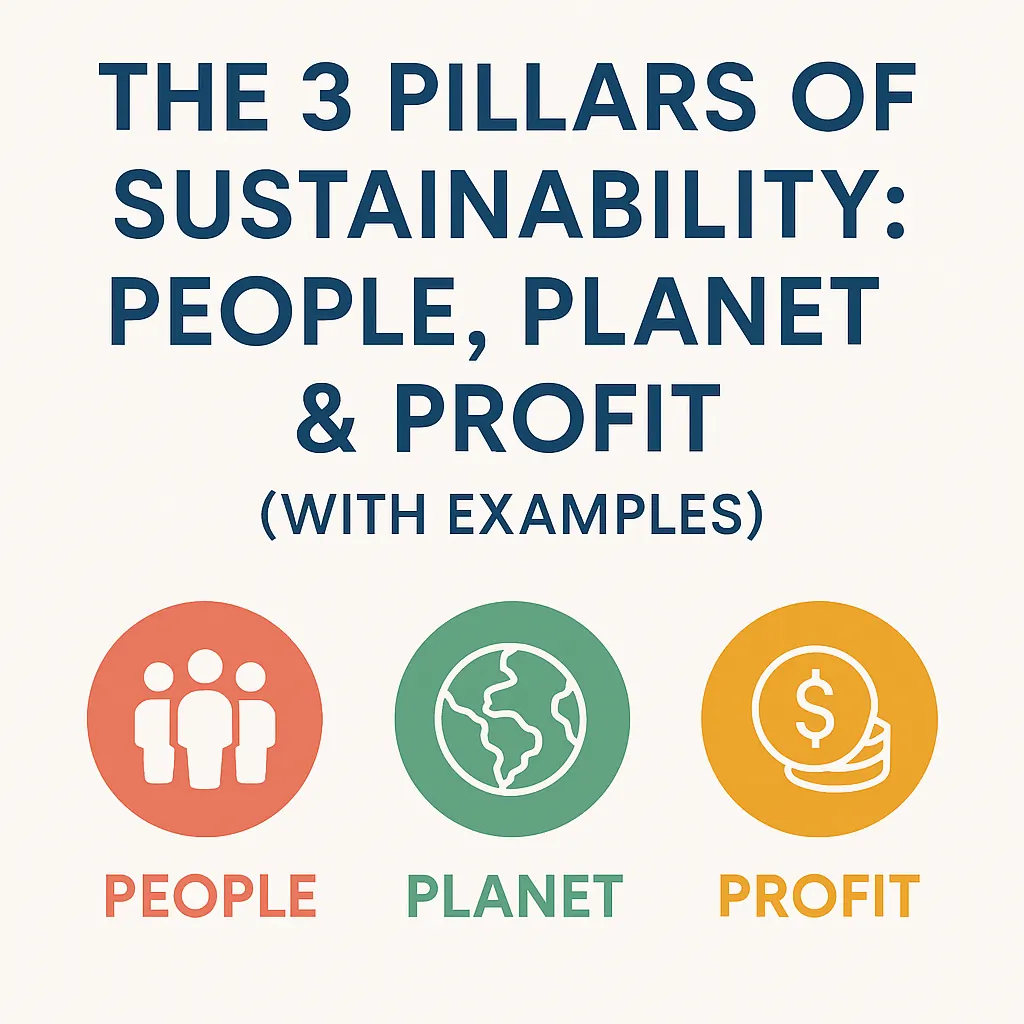
ESG as the Foundation of the Narrative
One of the most defining changes in sustainability report design is the positioning of ESG as the core of the narrative. Instead of isolating environmental and social efforts into a separate section, organizations are weaving them into every part of the report.
This approach changes how the story is told. Sustainability is no longer an addition. It becomes the lens through which business performance is explained. Design supports this by maintaining visual consistency across sections, reinforcing the idea that sustainability is integrated into every decision and outcome.

This also influences hierarchy. Key sustainability insights are presented early and prominently. The structure of the report reflects priorities, signaling to readers that impact is as important as financial performance.
Interactive Design as a New Standard
Interactivity is redefining how reports are consumed. Instead of passively reading, users actively engage with content. They click, expand, filter, and navigate through layers of information.
This shift changes the role of design. It is no longer about arranging content on a page. It is about creating pathways for exploration. Designers must think about user journeys, decision points, and the flow of information.
Interactive design also allows for depth without overwhelming the reader. Complex data can be hidden behind layers, revealed only when needed. This creates a balance between simplicity and richness, making the report accessible while still comprehensive.
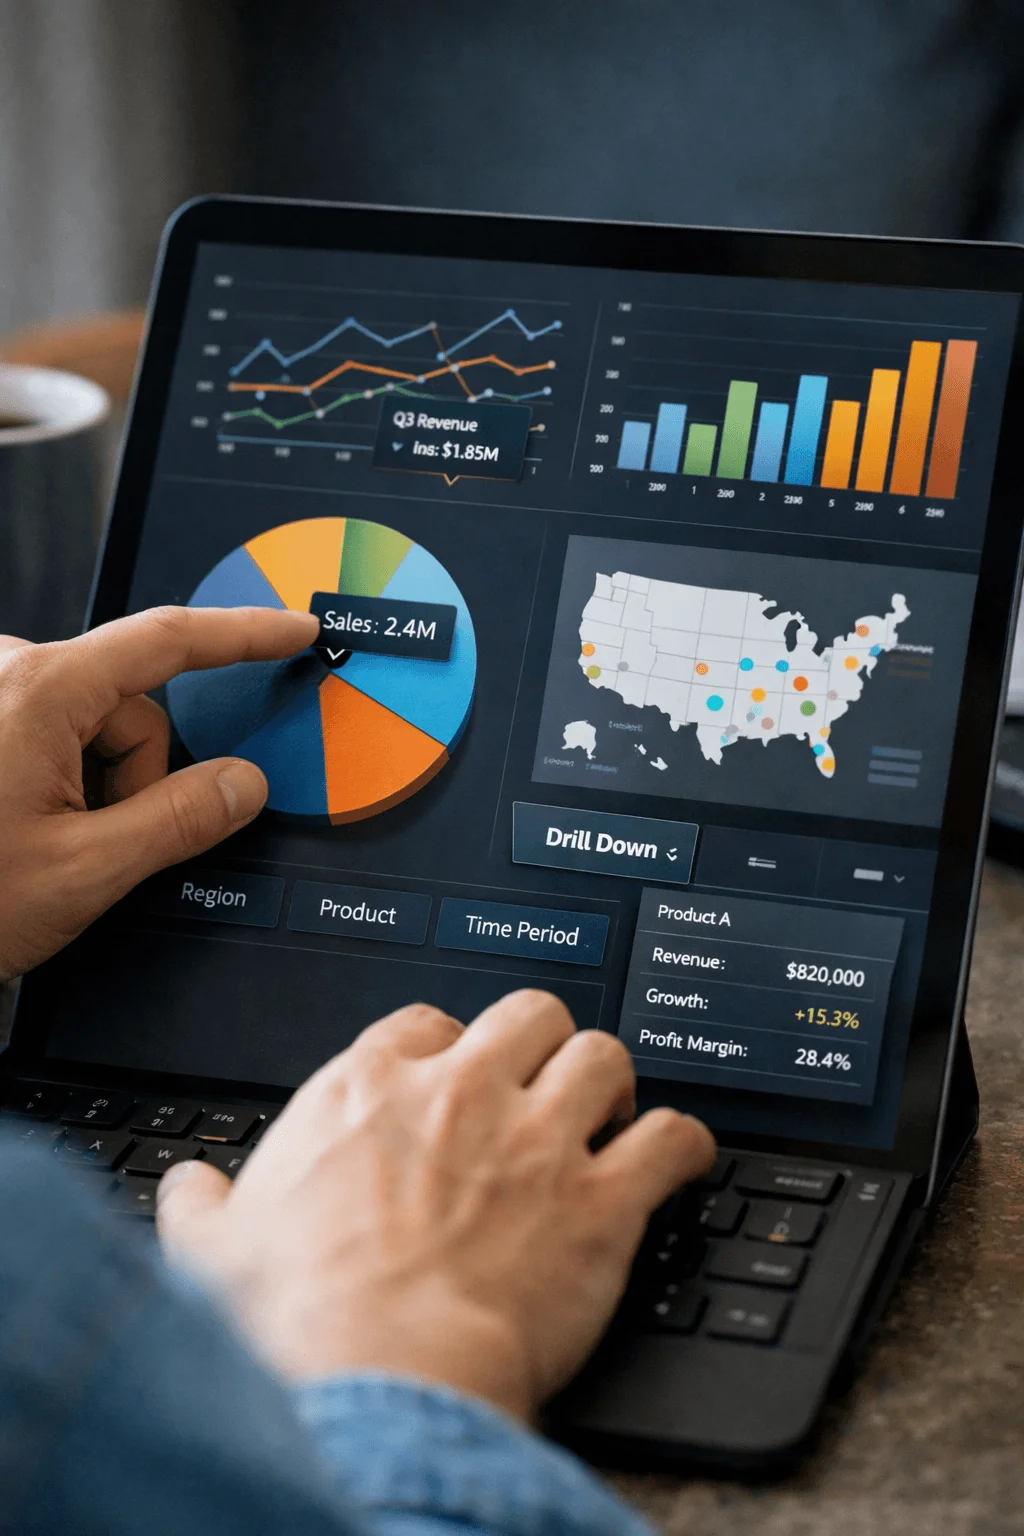
The Rise of Intelligent Data Visualization
Data is at the heart of sustainability reporting, but raw numbers alone cannot communicate meaning. The challenge lies in transforming data into insight. This is where intelligent visualization becomes essential.
In recent years, there has been a shift toward more advanced visual systems that go beyond basic charts. These systems are designed to highlight relationships, trends, and patterns in ways that are immediately understandable.

Artificial intelligence is beginning to play a role in this process. It enables the creation of visuals that adapt to data complexity and user interaction. This not only improves clarity but also allows organizations to present information in a more compelling and dynamic way.
Modular Thinking in Layout Design
Modular design introduces flexibility into the structure of sustainability reports. Instead of long continuous sections, content is organized into distinct units that can stand independently.
This approach reflects how people consume information in digital environments. Readers prefer shorter, focused segments that are easy to scan and understand. Modular layouts support this behavior by breaking down complexity into manageable parts.
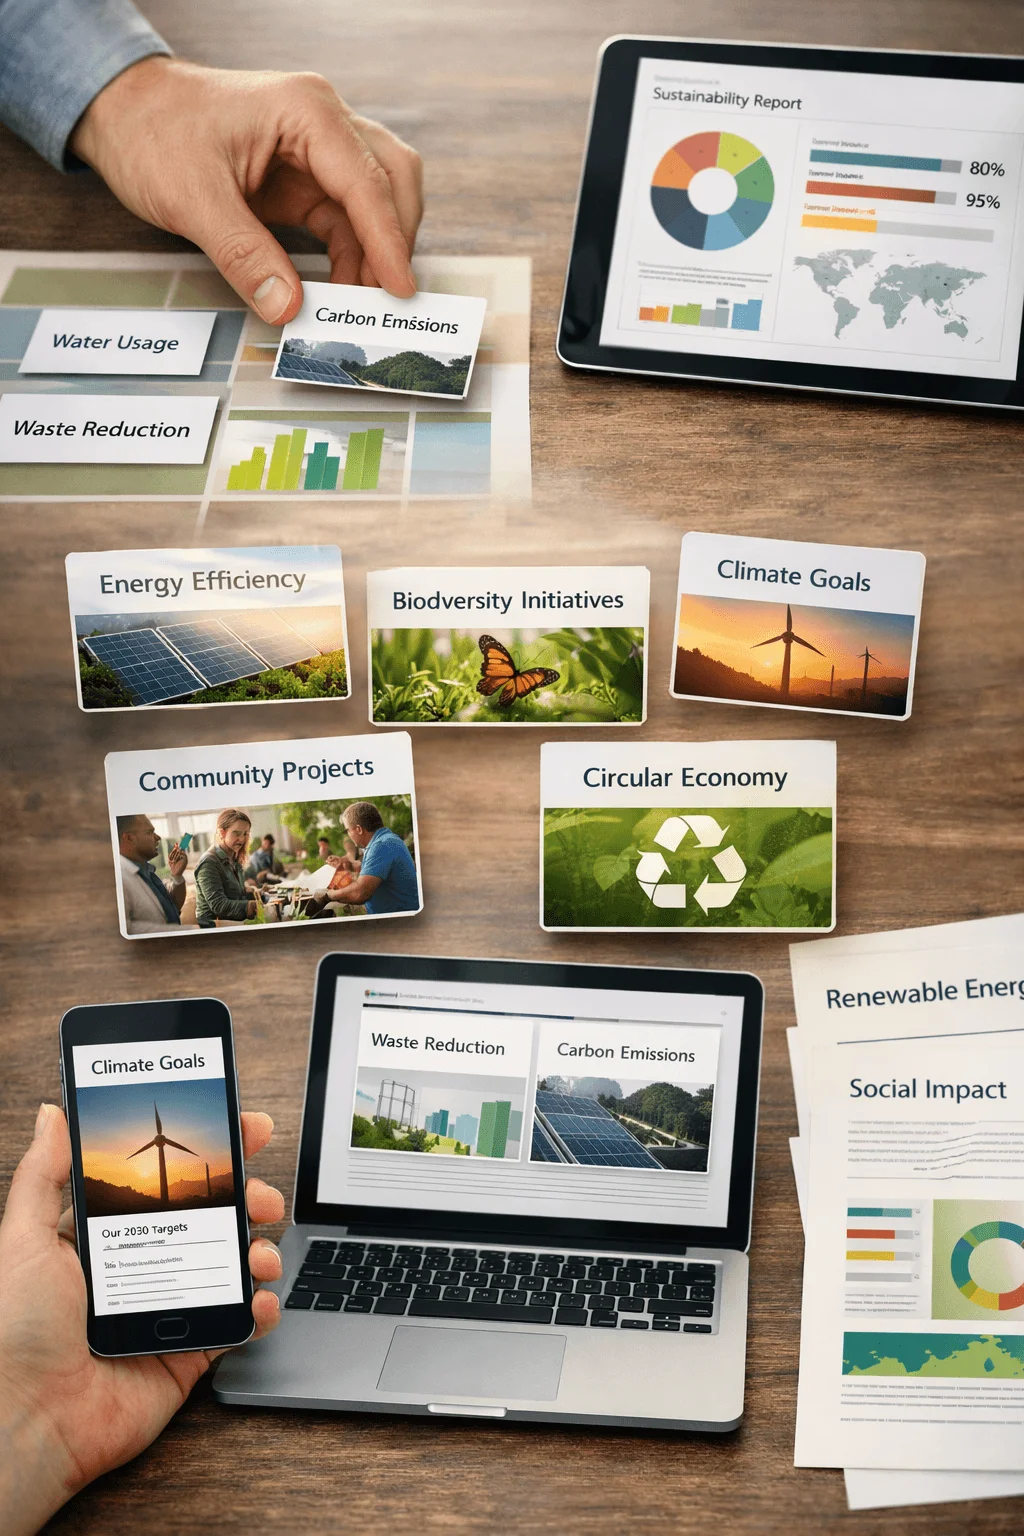
At a strategic level, modular design also enables adaptability. Content can be reused across different platforms, updated without disrupting the entire report, and tailored for different audiences. This makes the report more efficient and future ready.
Real Time Data and Continuous Reporting
The concept of annual reporting is gradually being challenged by the need for real time information. Stakeholders increasingly expect up to date insights rather than static snapshots.
This has led to the emergence of real time dashboards within sustainability reports. These dashboards provide ongoing updates on key metrics, offering a more accurate representation of performance.
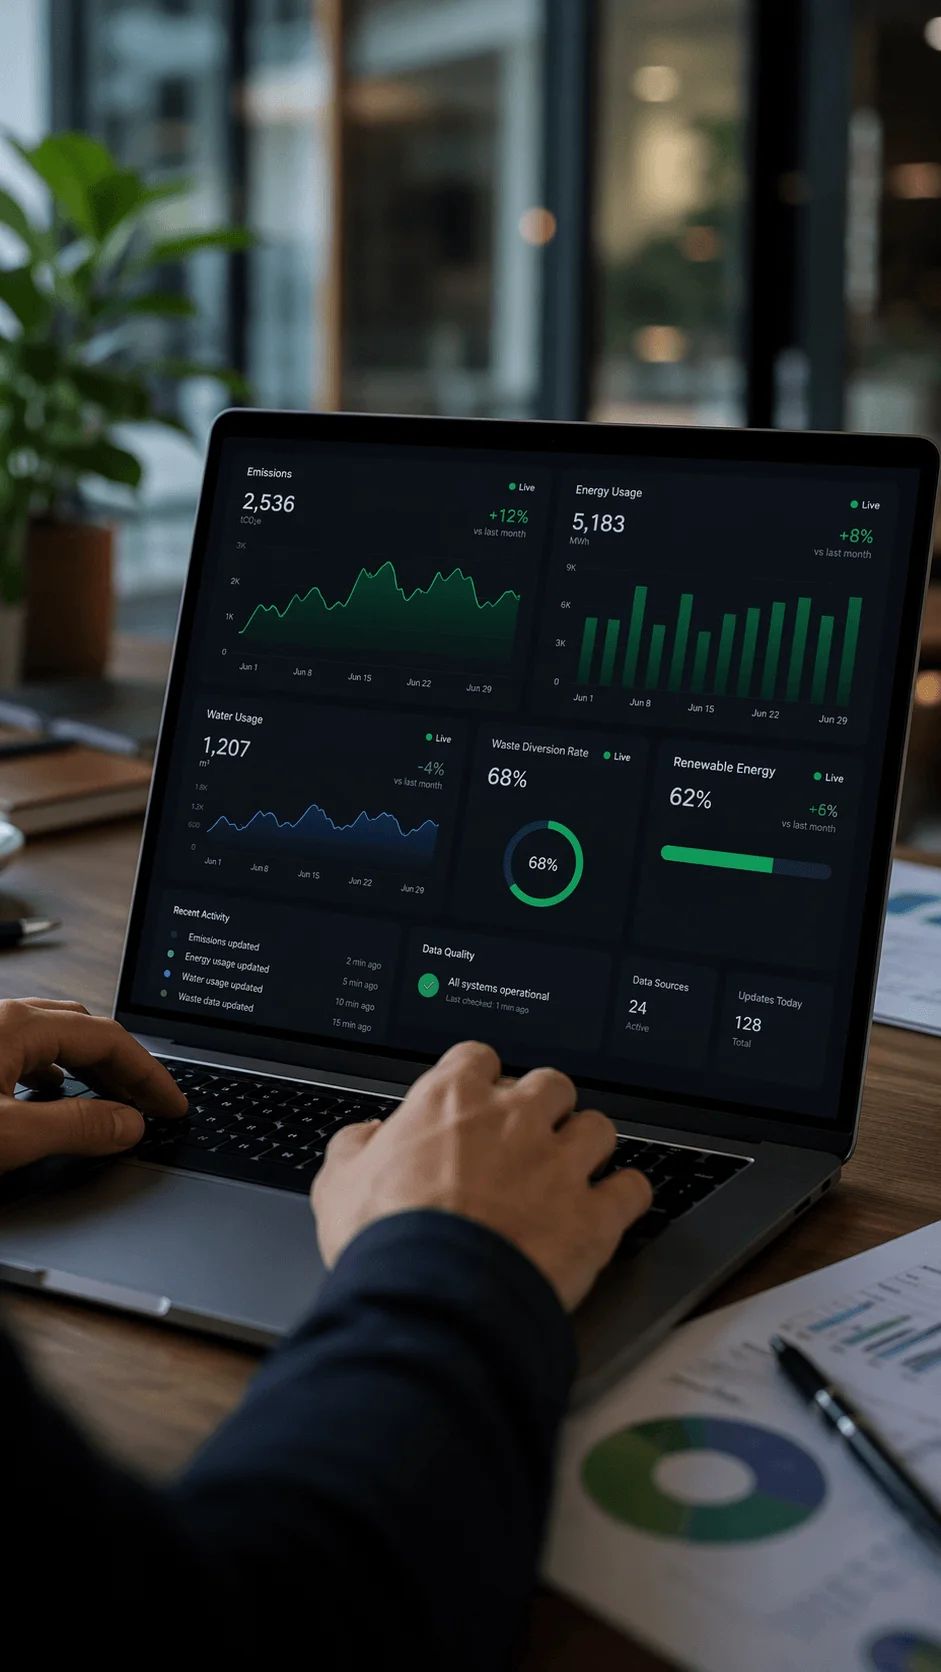
Designing for real time data requires careful consideration. Information must be presented clearly despite constant change. Visual systems must be stable yet flexible, ensuring that updates do not create confusion.
Human Stories at the Center of Data
While data provides evidence, stories create connection. Human centered storytelling brings sustainability efforts to life by focusing on real people, communities, and experiences.
This approach adds depth to the report. It moves beyond abstract metrics and shows tangible impact. Design plays a crucial role by integrating imagery, narrative elements, and contextual details that make stories more vivid.
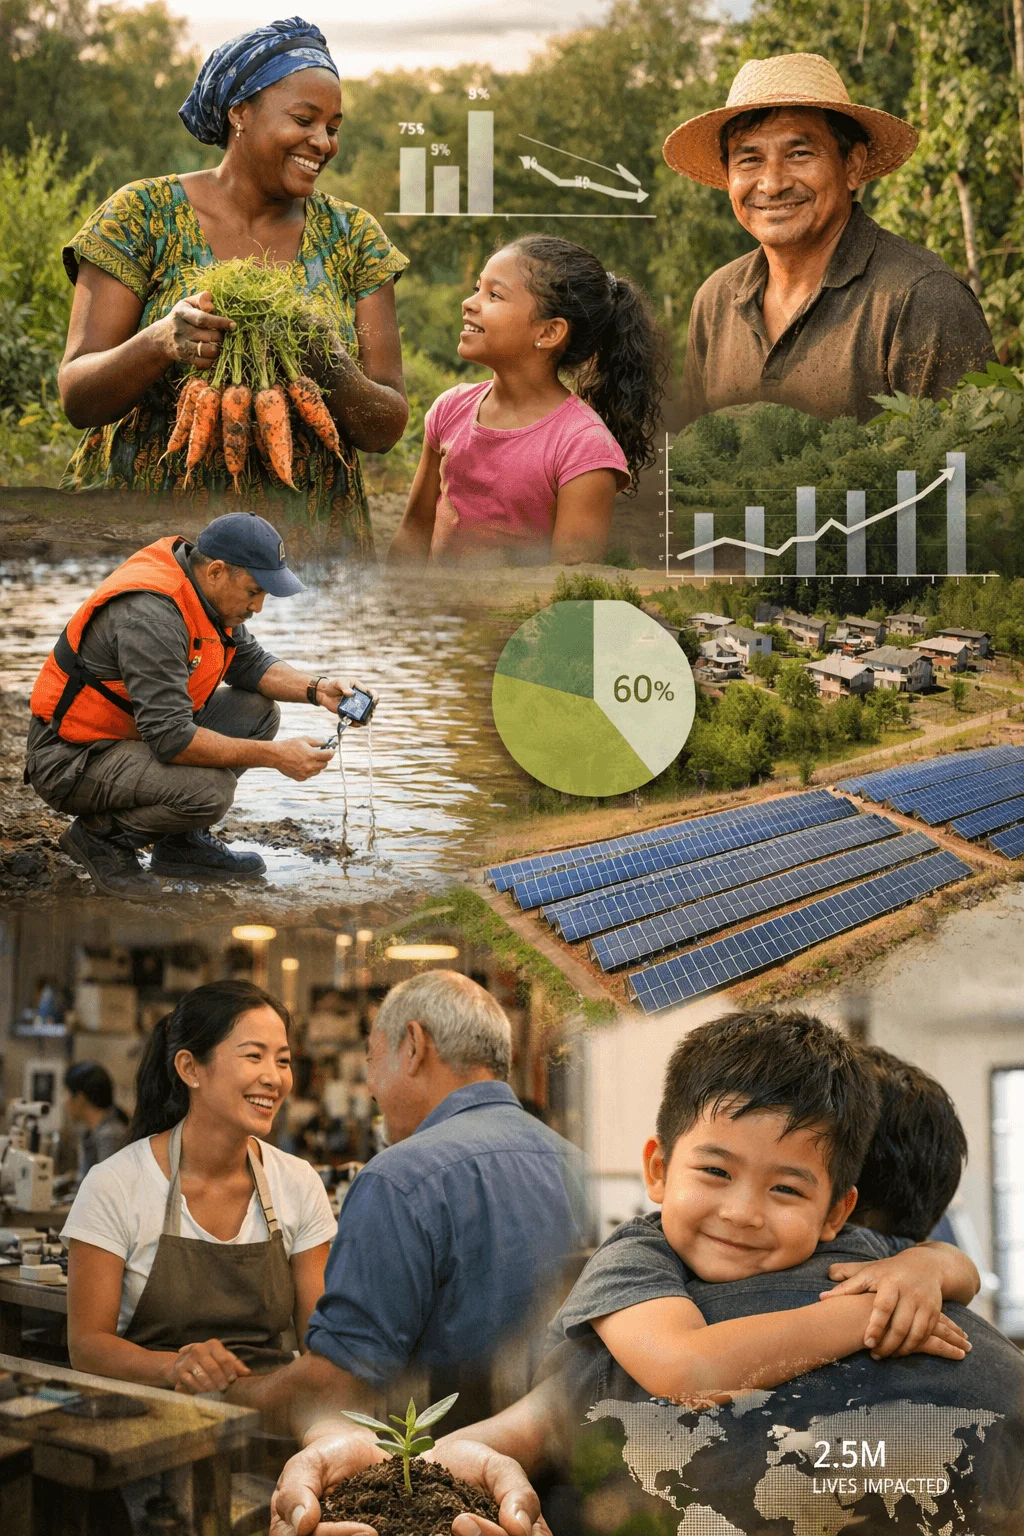
The goal is not to replace data but to complement it. When combined effectively, data and storytelling create a powerful narrative that is both informative and emotionally engaging.
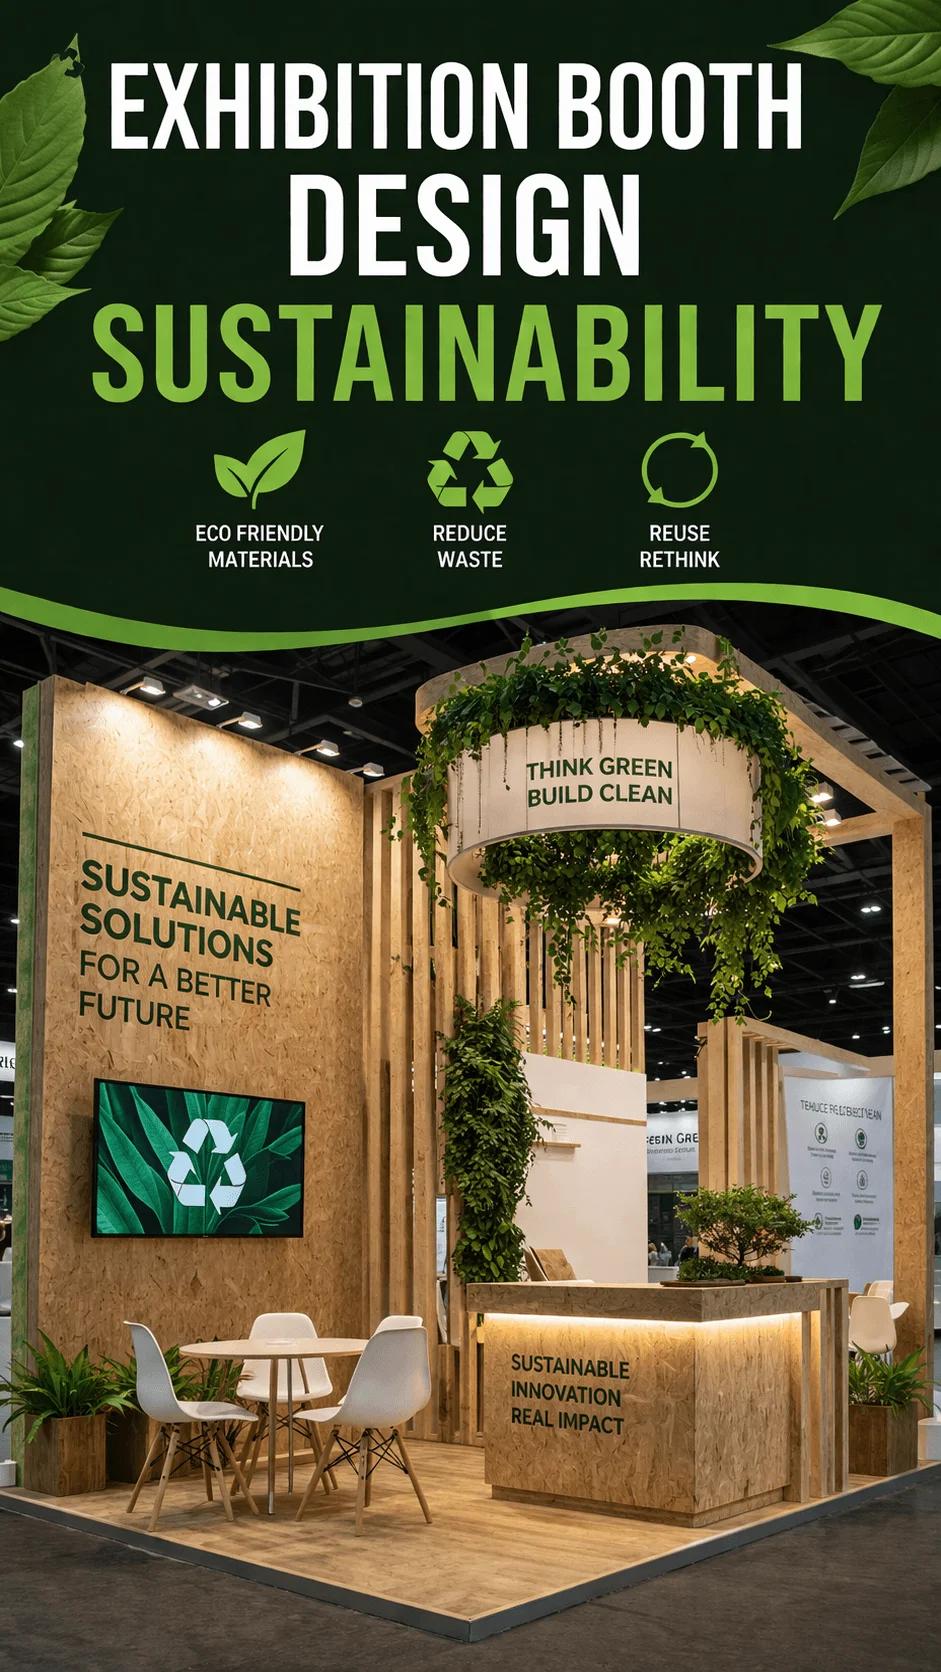
Nature Inspired Visual Language
Sustainability reports are increasingly using visual elements inspired by nature. This includes organic shapes, natural color palettes, and textures that evoke environmental themes.
This trend is not only aesthetic but also symbolic. It reinforces the message of sustainability by aligning visual design with environmental values. It creates a sense of authenticity and coherence.
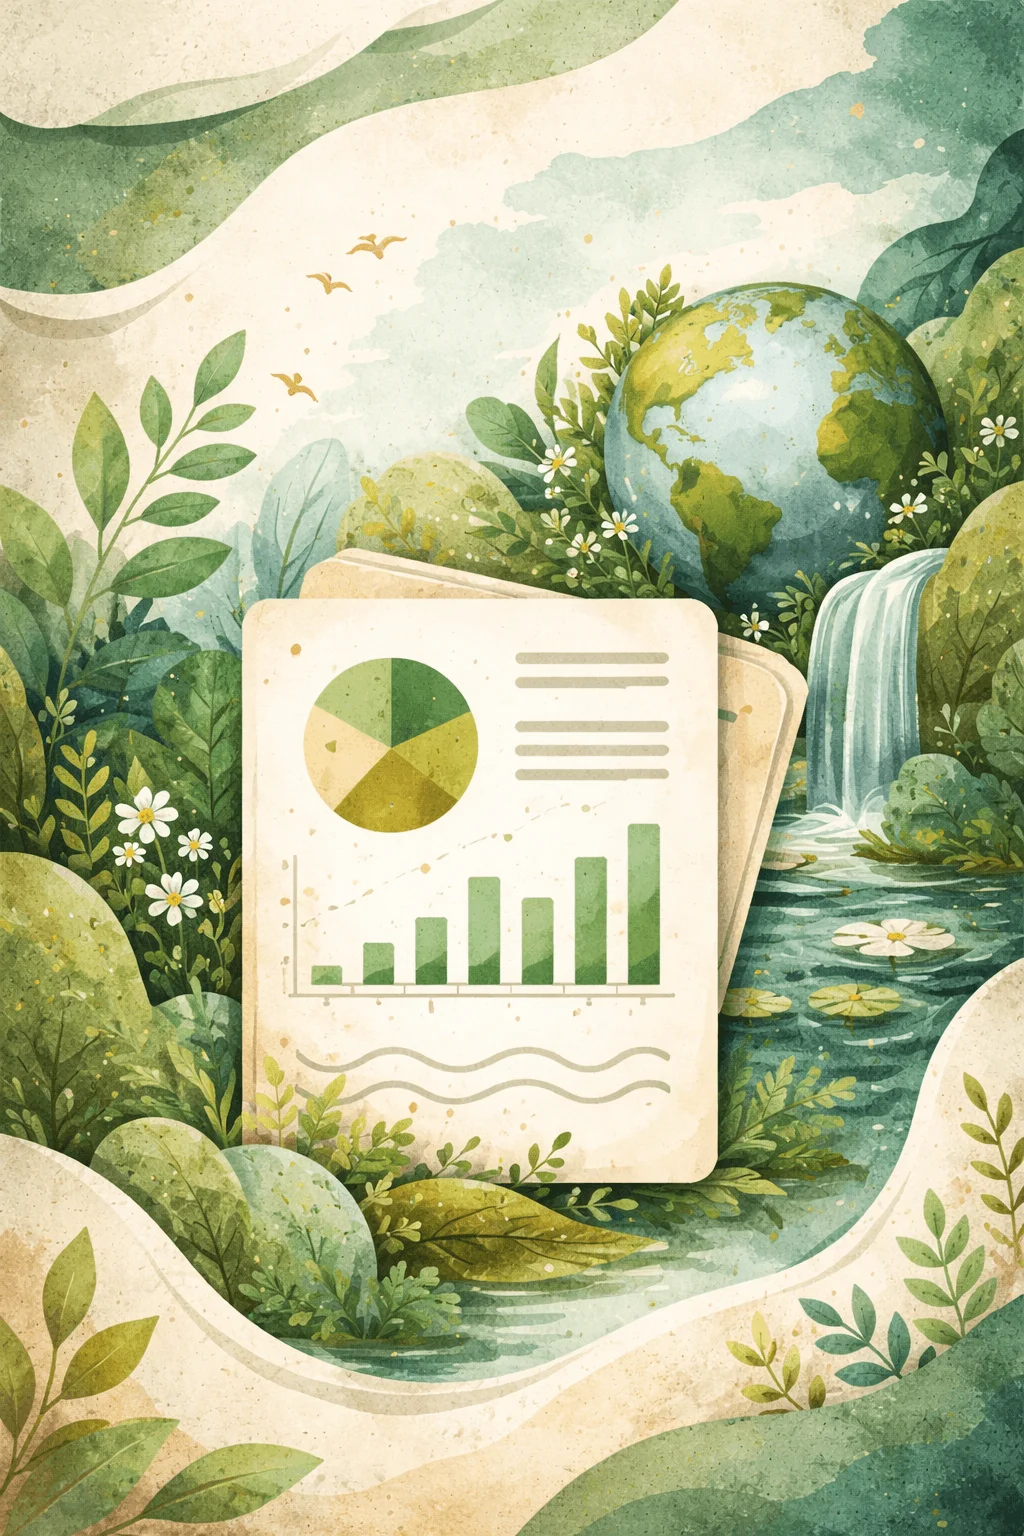
At a deeper level, nature inspired design also influences how information is structured. It encourages fluid layouts, softer transitions, and a more organic flow of content.
Minimalism that Enhances Understanding
Minimalism continues to be a dominant design approach, but its purpose has evolved. It is no longer about removing elements for the sake of simplicity. It is about enhancing understanding.
Effective minimalism focuses on clarity. It uses space, typography, and hierarchy to guide the reader’s attention. It ensures that important information stands out while reducing distractions.
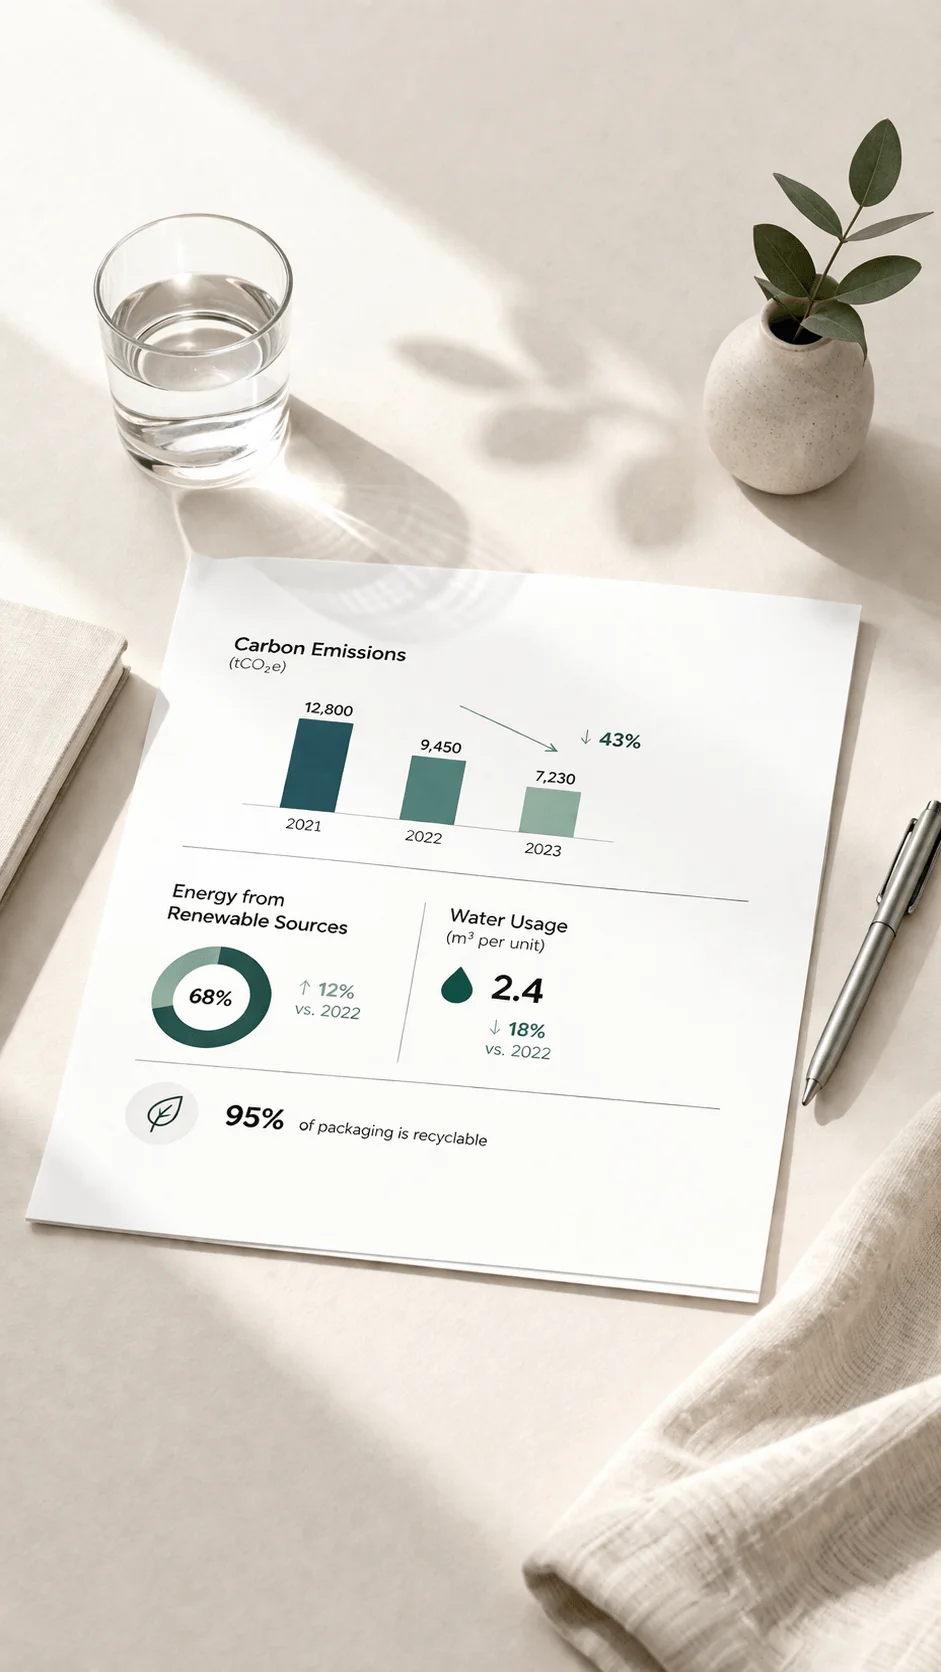
This approach is particularly valuable in sustainability reporting, where complexity can easily overwhelm. By simplifying presentation, minimalism makes information more accessible and easier to interpret.
Narrative Flow Through Scrolling
Scrolling has become a natural interaction in digital environments, and sustainability reports are embracing this behavior. Scrollytelling creates a continuous narrative that unfolds as the user moves through the content.
This technique allows for a more immersive experience. It combines text, visuals, and motion in a way that feels cohesive and engaging. Each section builds on the previous one, creating a sense of progression.
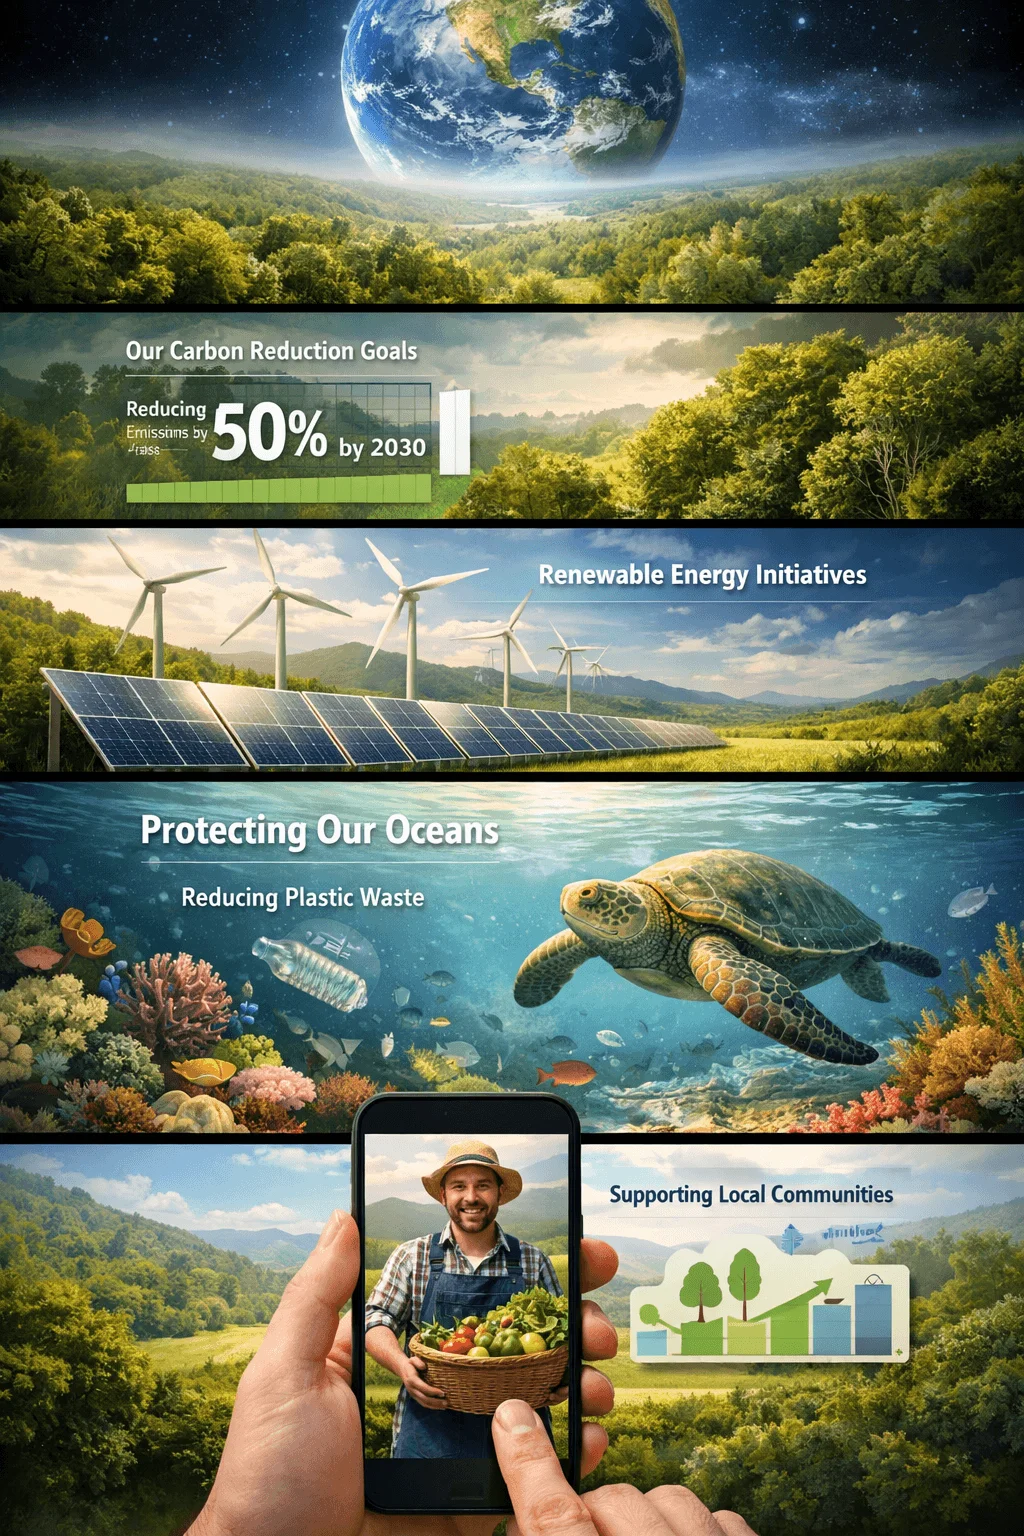
Designers use this approach to guide attention, reveal information gradually, and maintain engagement. It transforms the report into a journey rather than a collection of pages.
Designing for Transparency and Trust
Transparency is a fundamental expectation in sustainability reporting. Stakeholders want to see not only achievements but also challenges and areas for improvement.
Design plays a critical role in communicating transparency. It involves presenting data clearly, avoiding misleading visuals, and providing context for interpretation.
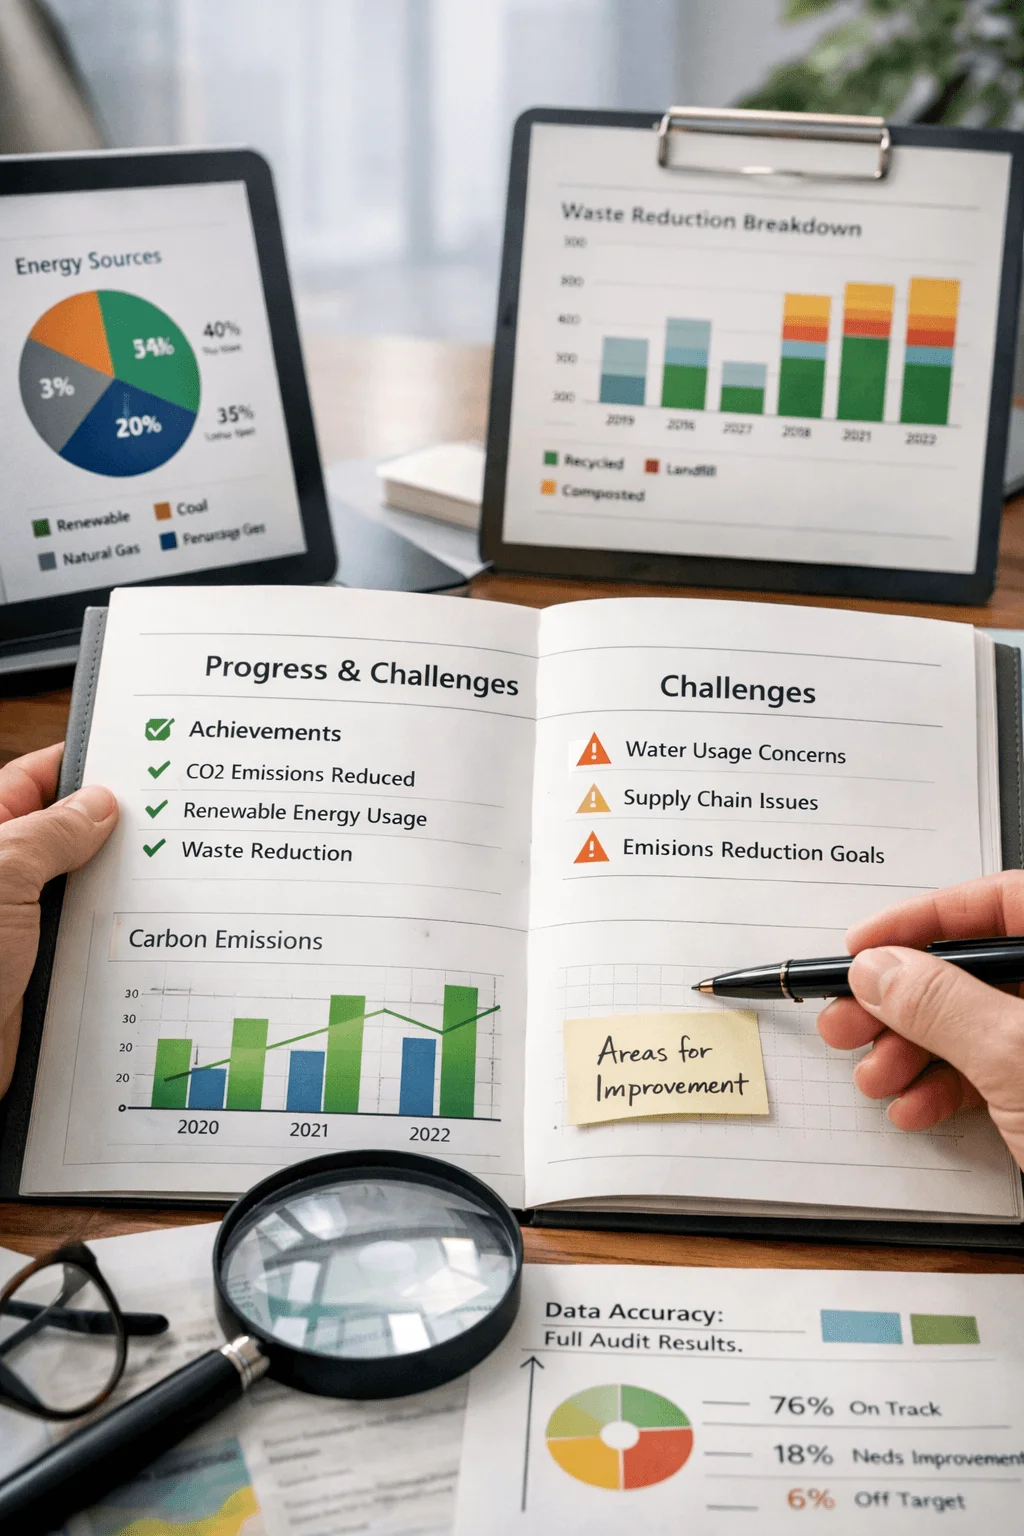
This approach builds trust. It shows that the organization is willing to be open and accountable. In a landscape where credibility is essential, transparency driven design becomes a key differentiator.
Personalization and User Control
Different audiences have different needs. Investors, employees, and the general public all look for different types of information. Personalization addresses this by allowing users to tailor their experience.
This can include filtering content, selecting areas of interest, or navigating through customized pathways. Design must support this flexibility while maintaining coherence.
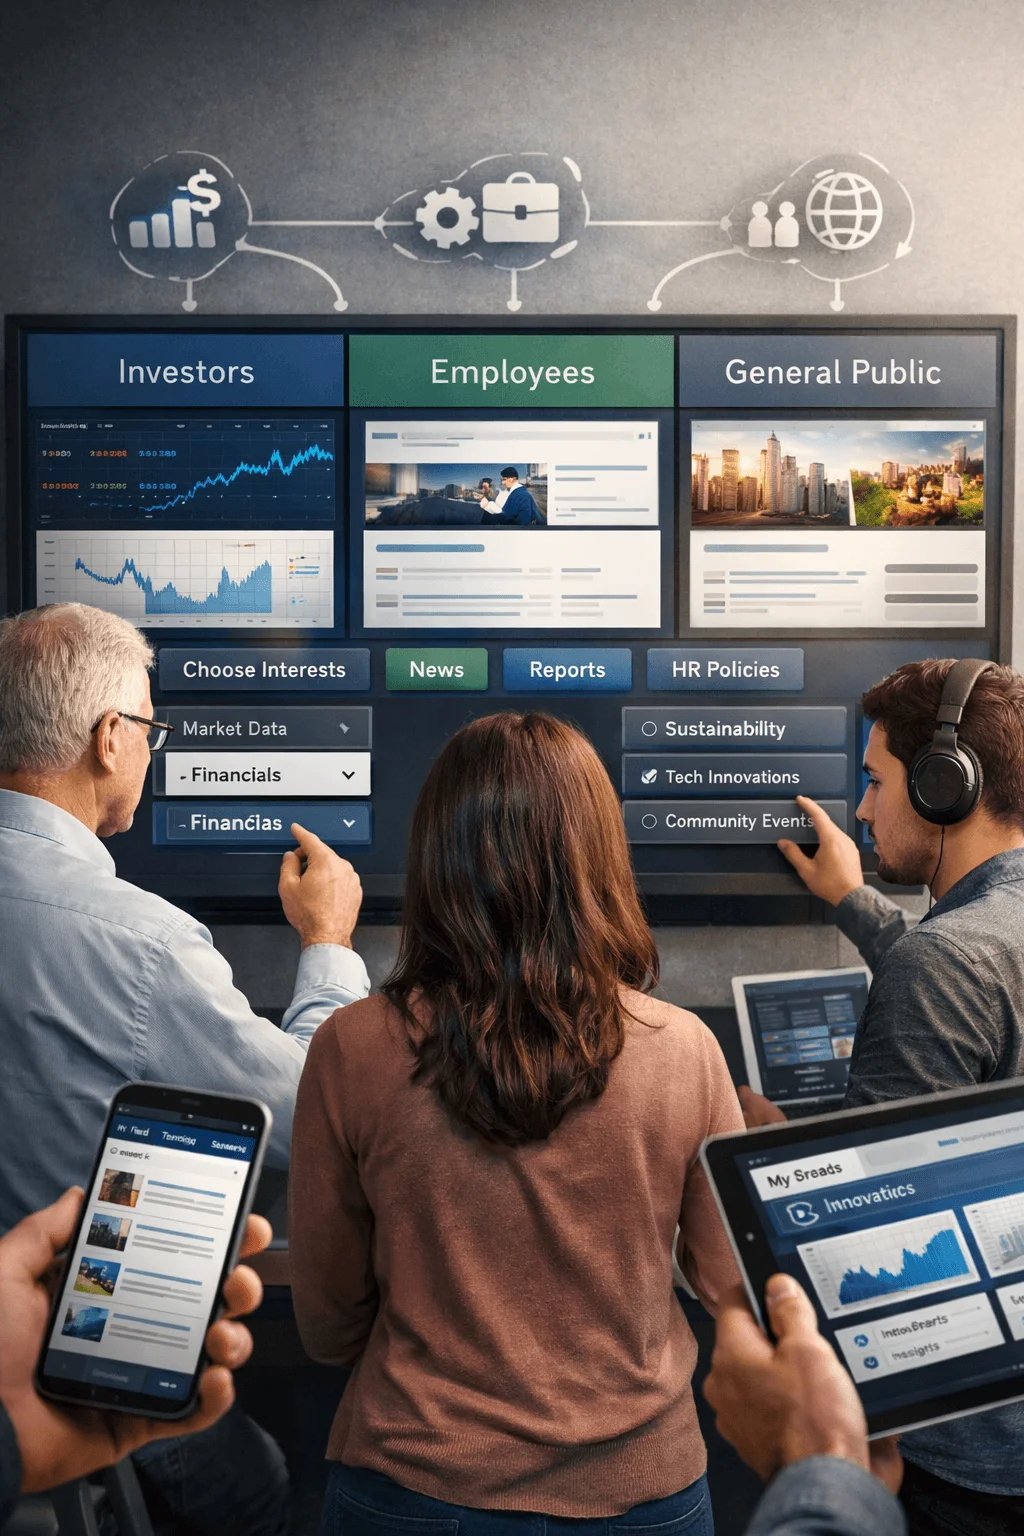
Personalization enhances relevance. It ensures that users can access the information that matters most to them without unnecessary complexity.
Accessibility as a Core Principle
Accessibility is no longer optional. It is a fundamental aspect of responsible design. Sustainability reports must be usable by a diverse audience, including individuals with different abilities.
This involves considerations such as readability, contrast, navigation, and compatibility with assistive technologies. It requires a thoughtful approach that prioritizes inclusivity.
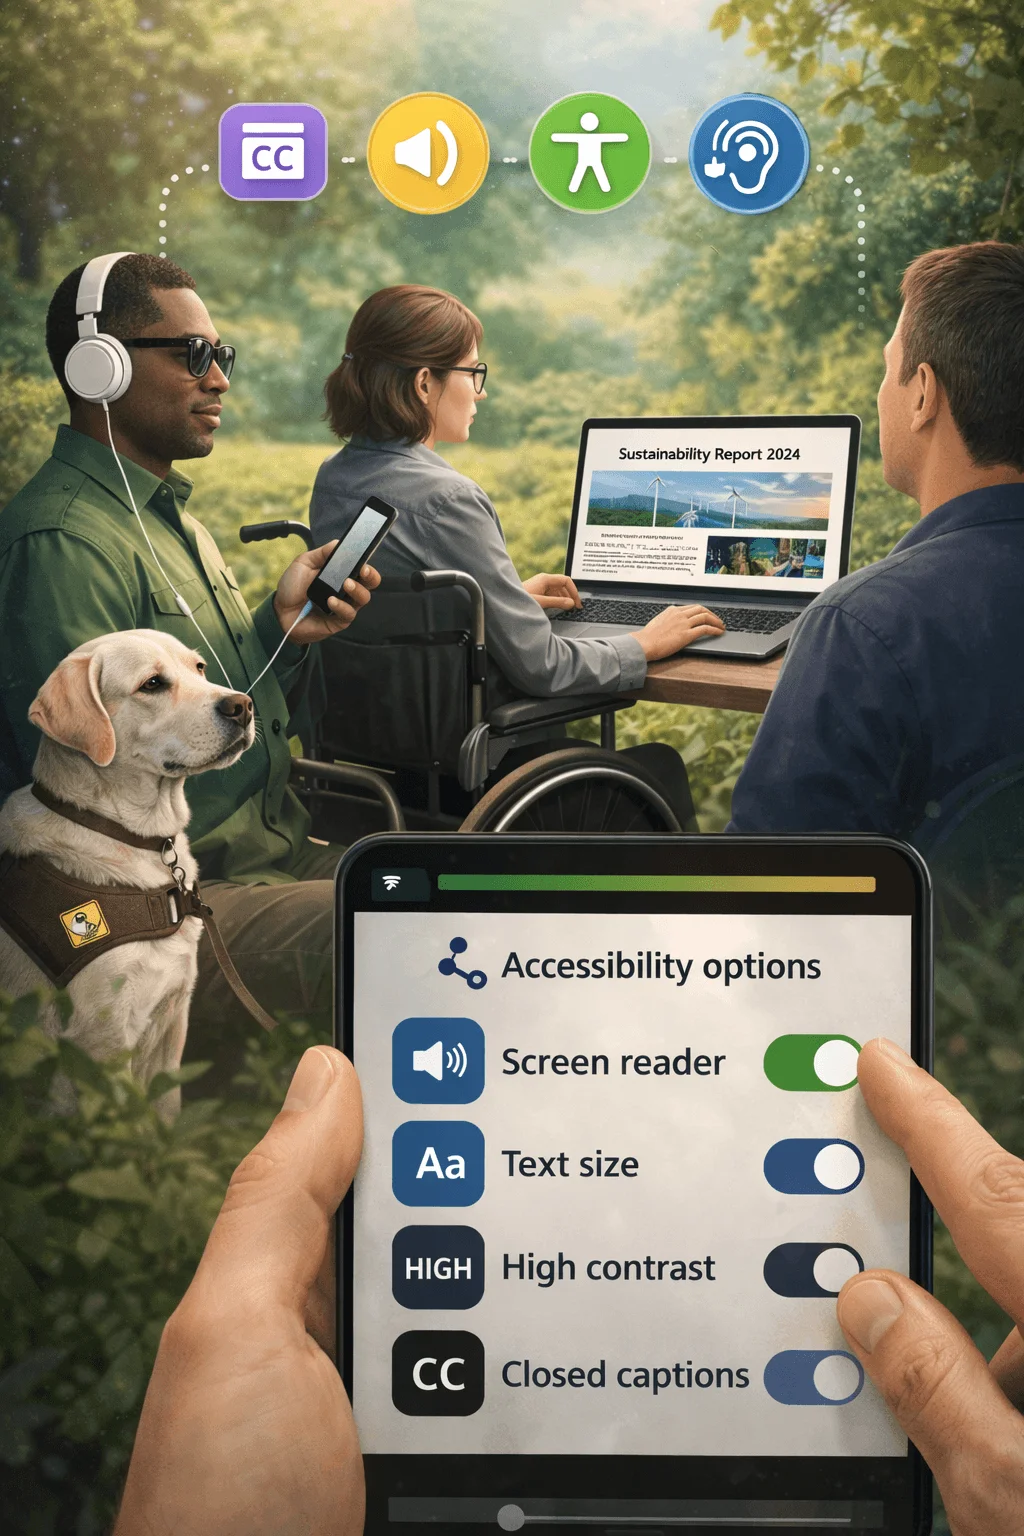
Accessibility also aligns with the broader values of sustainability. It reflects a commitment to equity and ensures that information is available to all.
Visualizing Carbon and Environmental Impact
One of the key challenges in sustainability reporting is communicating environmental impact in a way that is both accurate and understandable. Carbon data, in particular, can be complex and difficult to interpret.
Designers are developing new ways to visualize this information. They use comparisons, timelines, and interactive elements to make data more meaningful.
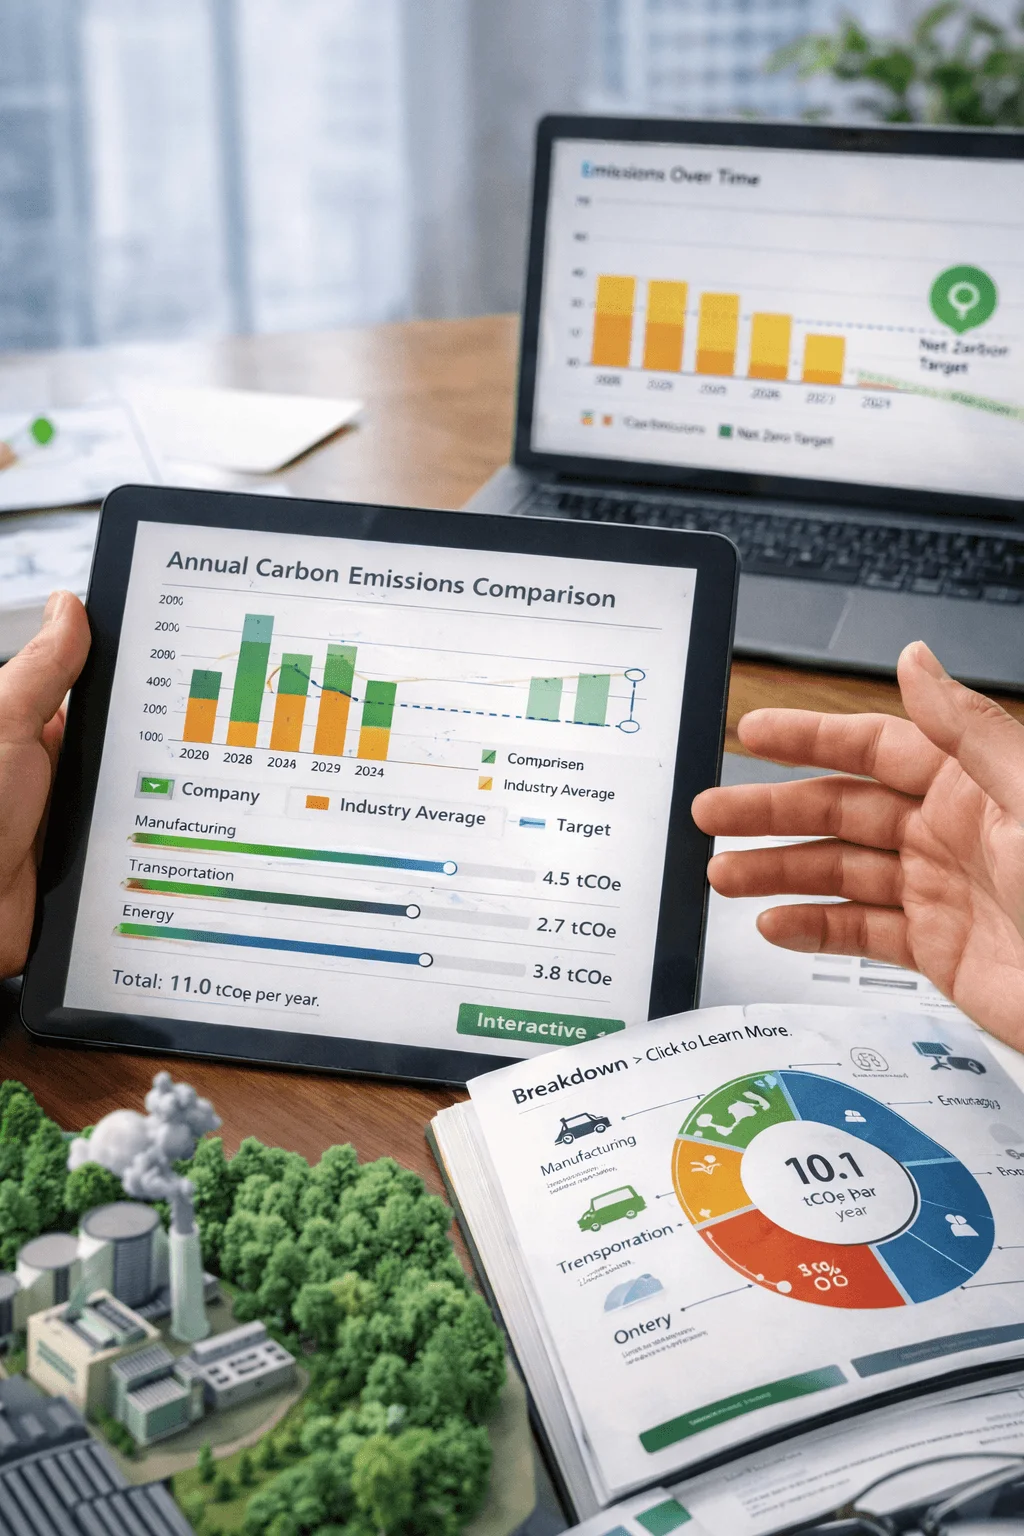
The goal is to move beyond numbers and create understanding. Effective visualization helps stakeholders grasp the scale of impact and the progress being made.
Motion and Dynamic Content
Motion adds a new dimension to sustainability reports. It brings content to life and enhances engagement. Subtle animations can guide attention, while more complex motion can illustrate processes and relationships.
This trend reflects the influence of digital media, where movement is an integral part of communication. When used thoughtfully, motion enhances clarity rather than distracting from it.
It also creates a sense of modernity, positioning the report as a contemporary and forward thinking piece of communication.
Circular Thinking in Report Design
Circular thinking extends the principles of sustainability into the design process itself. It involves creating reports that are efficient, adaptable, and aligned with environmental values.
This can include optimizing file sizes, reducing unnecessary elements, and designing layouts that can be reused or updated. It reflects a holistic approach where the report is not only about sustainability but also practices it.

This trend highlights the importance of consistency between message and execution. It ensures that the report embodies the values it communicates.
Conclusion
Annual sustainability report design in 2026 reflects a profound shift in how organizations communicate impact. It is no longer about presenting information in a structured format. It is about creating meaningful experiences that inform, engage, and inspire.
The trends shaping this evolution show a clear direction. Reports are becoming more interactive, more human, and more transparent. They are designed with the user in mind, balancing clarity with depth and simplicity with richness.
Organizations that embrace these approaches will be better positioned to communicate their sustainability efforts effectively. In a world where trust and accountability are essential, design is not just a tool. It is a strategic asset that transforms information into understanding and intention into impact.