Sustainability Concept Diagram Architecture for Green Building Design
Sustainability concept diagram architecture helps designers explain how a building responds to climate, energy, water, materials, ecology, and people. In modern architecture, a concept diagram does more than decorate a presentation board. It shows the thinking behind a design and makes complex sustainable strategies easy to understand. When a viewer looks at a strong diagram, they should understand how sunlight enters the building, how wind moves through spaces, how water gets collected, how materials reduce waste, and how the project supports healthier living.
Architecture has entered a time when every design decision carries environmental meaning. A building can no longer stand as an isolated object. It must connect with its site, climate, community, and future life cycle. This is why sustainability concept diagram architecture has become important for students, architects, urban designers, and clients. It turns invisible systems into visible stories. Energy use, carbon impact, natural ventilation, biodiversity, and social comfort become readable through arrows, layers, icons, zones, and labels.
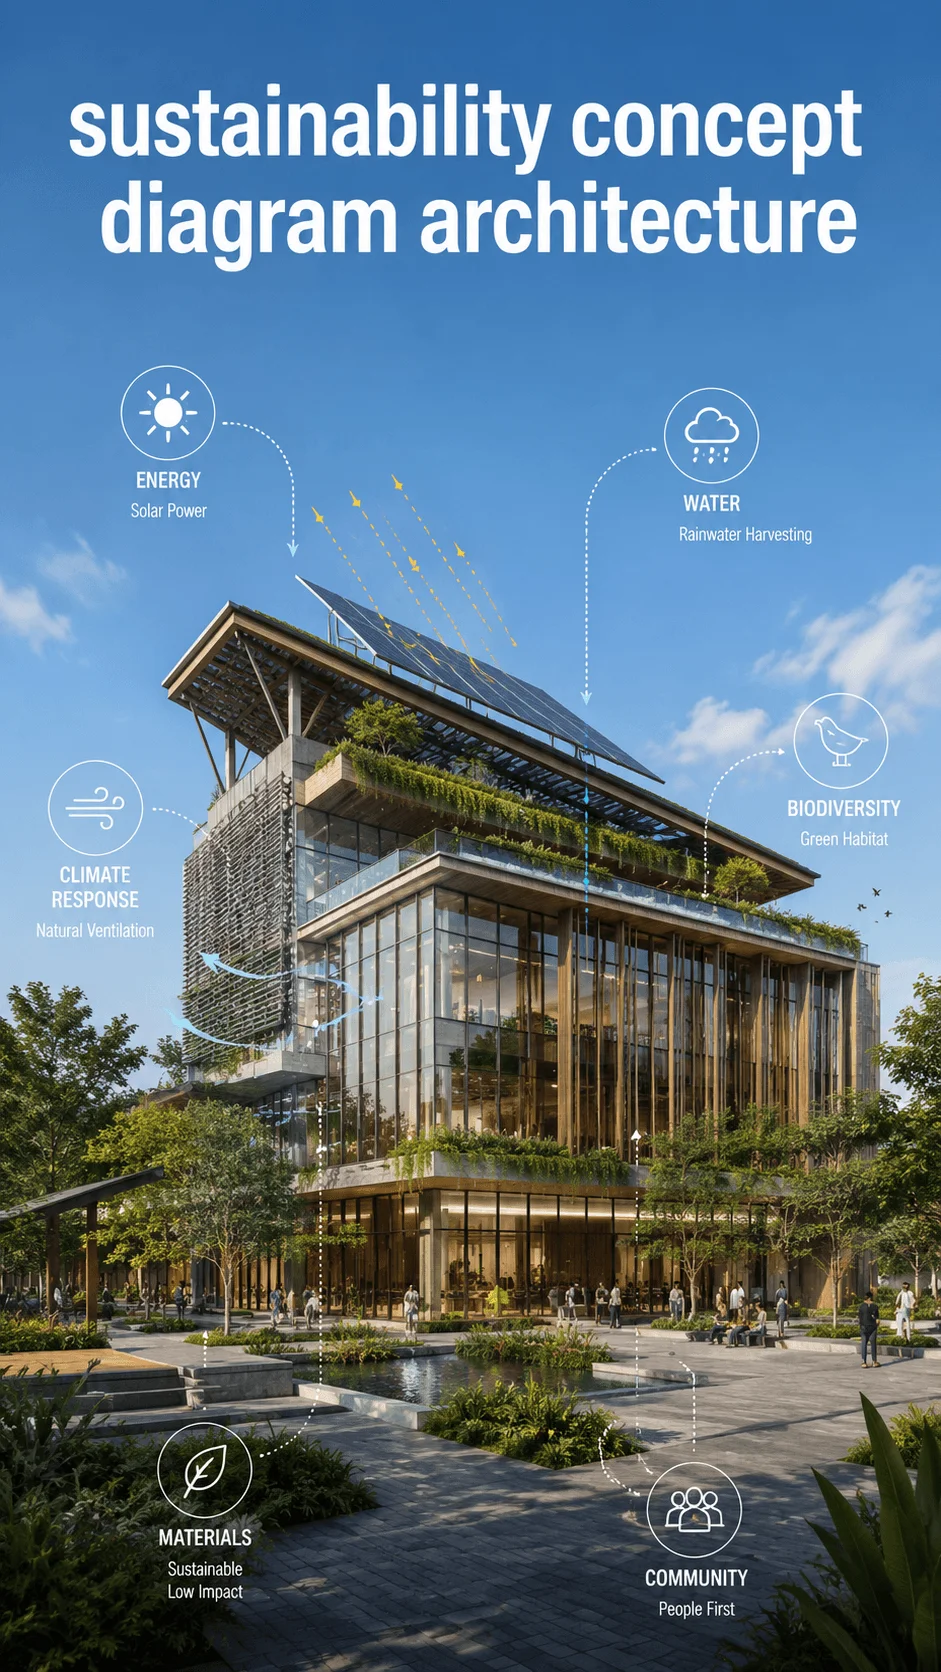
A good sustainable diagram should start with a clear idea and build a visual argument. The best diagrams show cause and effect. The sun path creates shading needs, shading reduces heat gain, lower heat gain reduces cooling demand, and lower energy demand supports a net zero goal. This visual logic helps people understand why the building looks and works the way it does.
Why Sustainable Architecture Concept Diagrams Matter Today
A sustainable architecture concept diagram gives shape to design intelligence. Many green building ideas stay hidden inside technical reports, energy models, or material schedules. A diagram brings them into the open. It allows a designer to communicate with people who may not read engineering data but can understand a visual story.
Architecture now deals with many challenges at once. Buildings must reduce carbon, save water, improve comfort, protect biodiversity, support health, and adapt to climate change. One thoughtful diagram can show how these goals work together. It can explain how a courtyard improves daylight, how a green roof absorbs rain, and how shared spaces strengthen community life.
Regenerative Architecture Diagram for Living Systems
Regenerative design goes beyond reducing harm. It asks a building to improve the place where it stands. A regenerative architecture diagram should show the building as part of a living system rather than a sealed object. It can include soil, plants, rainwater, sunlight, wildlife, people, air movement, and local culture.
This idea feels more advanced than basic green design. A traditional sustainable building may aim to use less energy. A regenerative building tries to restore natural cycles. A school can collect rainwater, grow food, create shaded outdoor classrooms, support pollinators, and become a learning landscape for children.
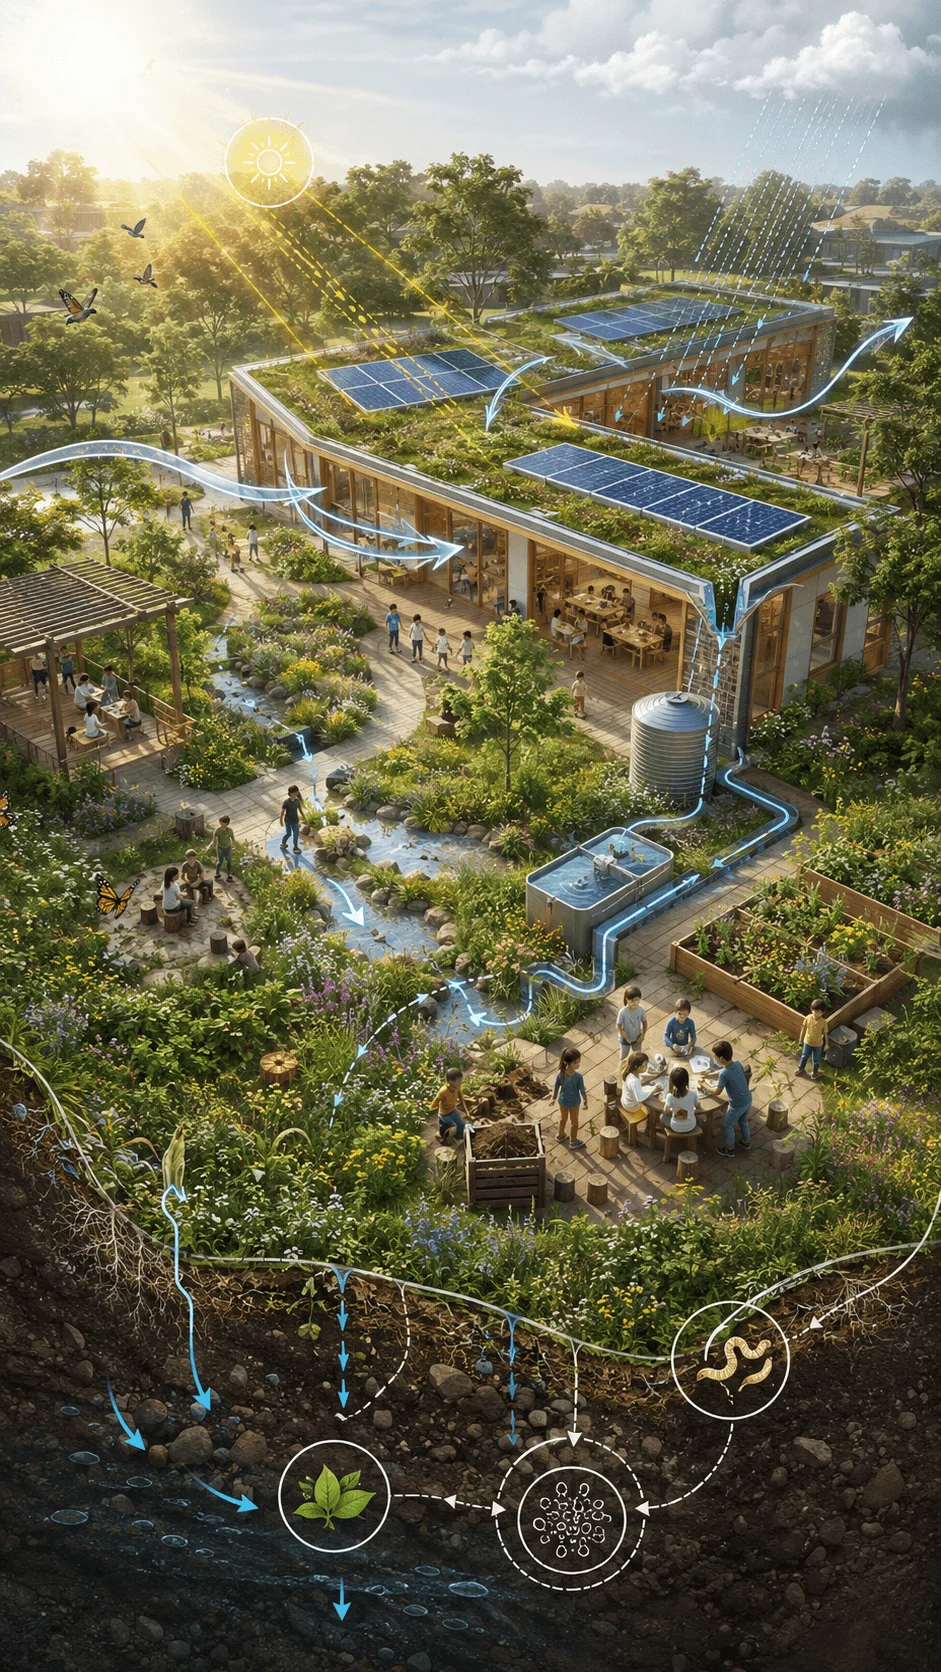
In sustainability concept diagram architecture, regenerative design needs soft boundaries. The building should visually connect with the landscape. Arrows can show water moving from roof to garden, nutrients returning to soil, and people moving between indoor and outdoor learning zones.
Net Zero Architecture Concept Diagram
A net zero architecture concept diagram explains how a building balances the energy it uses with the energy it produces or saves. The diagram should show passive design first, because reducing demand matters before adding technology.
A clear net zero diagram can include building orientation, daylight access, roof solar panels, shaded windows, high performance insulation, natural ventilation, efficient systems, heat pumps, and battery storage. The diagram should show how the building reduces energy need through shape and climate response before it depends on machines.

This approach makes sustainability concept diagram architecture more practical. Instead of saying a building is green, the diagram proves how it works. It can show morning light entering workspaces, roof panels producing electricity, warm air escaping through high vents, and shaded walls reducing cooling load.
Circular Material Flow Diagram in Architecture
A circular material flow diagram focuses on the life of building materials. It shows where materials come from, how they get used, how long they last, and where they go after the building changes or reaches the end of its life. This idea has become very important because construction creates huge waste and consumes large amounts of raw resources.
A strong circular diagram can show reclaimed timber, recycled steel, modular wall panels, reusable flooring, low carbon concrete, local stone, and material banks. It can also show future disassembly. This means the building does not become waste after use. Instead, its parts can move into another project.
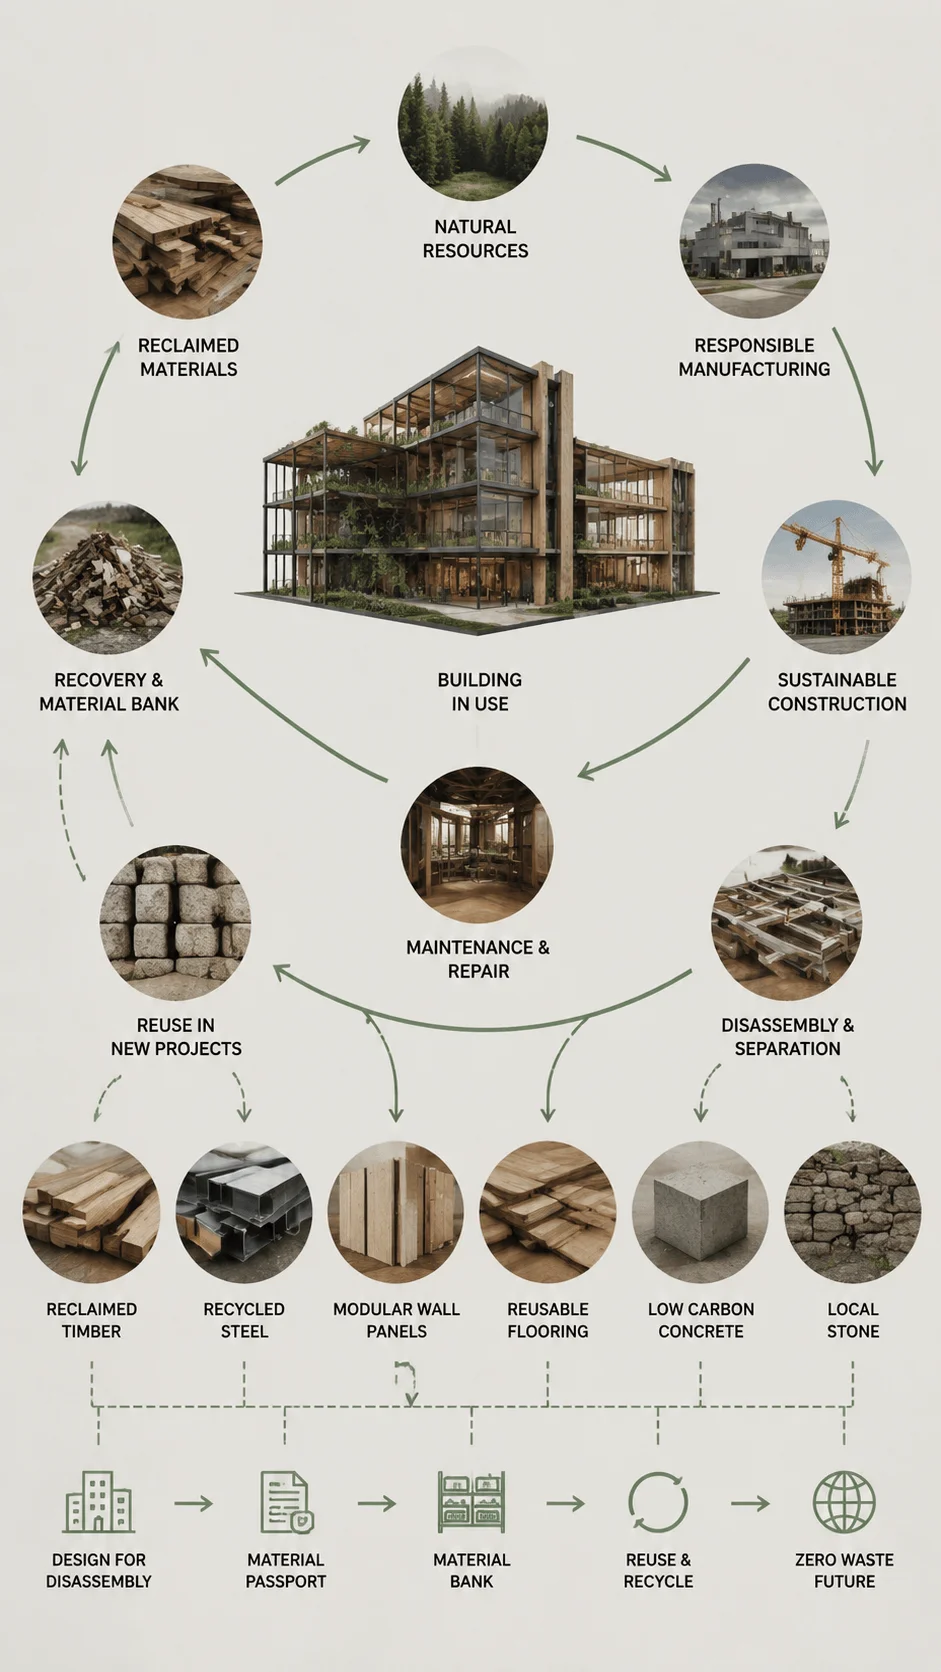
Circular design changes the way architects think. They do not only design a building for today. They design a material journey. Arrows can move from source to construction, from construction to use, from use to repair, and from repair to reuse.
Embodied Carbon Mapping Diagram
Embodied carbon refers to the emissions linked with producing, transporting, installing, maintaining, and replacing materials. Many people understand operational energy, but fewer understand the carbon hidden inside concrete, steel, glass, insulation, and finishes. That makes this topic valuable for a detailed article.
An embodied carbon diagram can divide a building into foundation, structure, envelope, interior, roof, and landscape. Each part can carry a carbon intensity label. Darker tones or larger blocks can show higher carbon impact, while lighter areas can show lower impact choices.
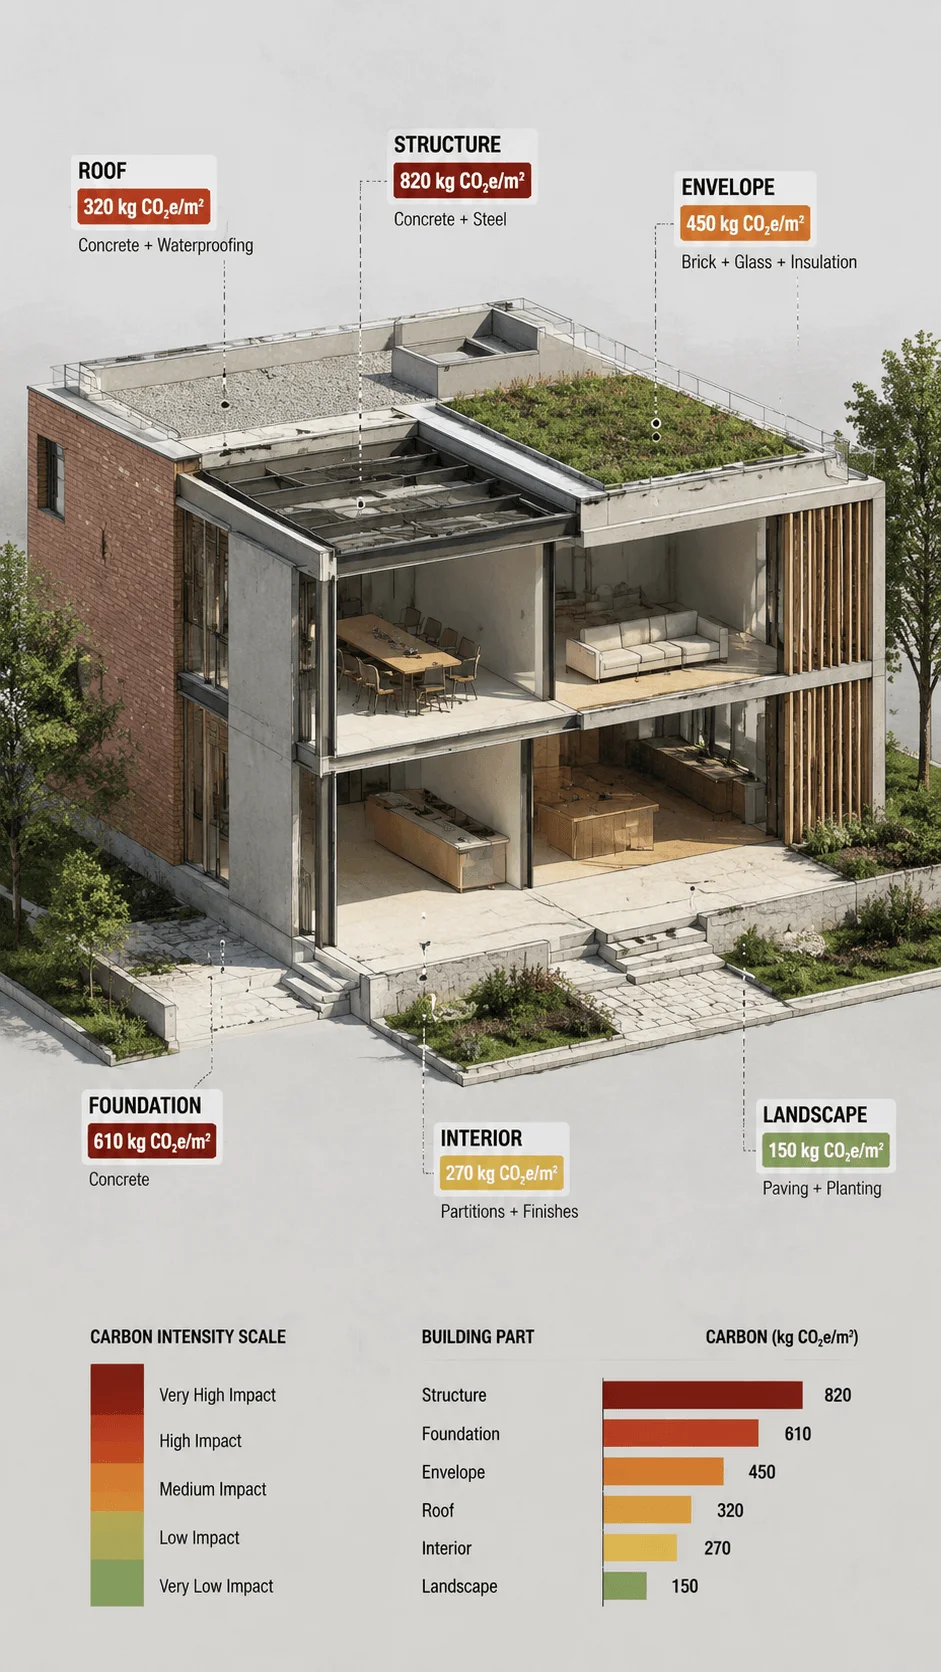
This form of sustainability concept diagram architecture helps designers make better decisions. If the structure creates the largest carbon load, the team may choose timber, reduce spans, reuse an existing frame, or design more efficiently. The diagram turns carbon into a visible design factor.
Biophilic Architecture Concept Diagram
Biophilic design connects buildings with nature and human wellbeing. A biophilic architecture concept diagram can show daylight, natural views, indoor plants, courtyards, water features, fresh air, natural textures, green walls, and quiet outdoor spaces. It should also show how people experience these features.
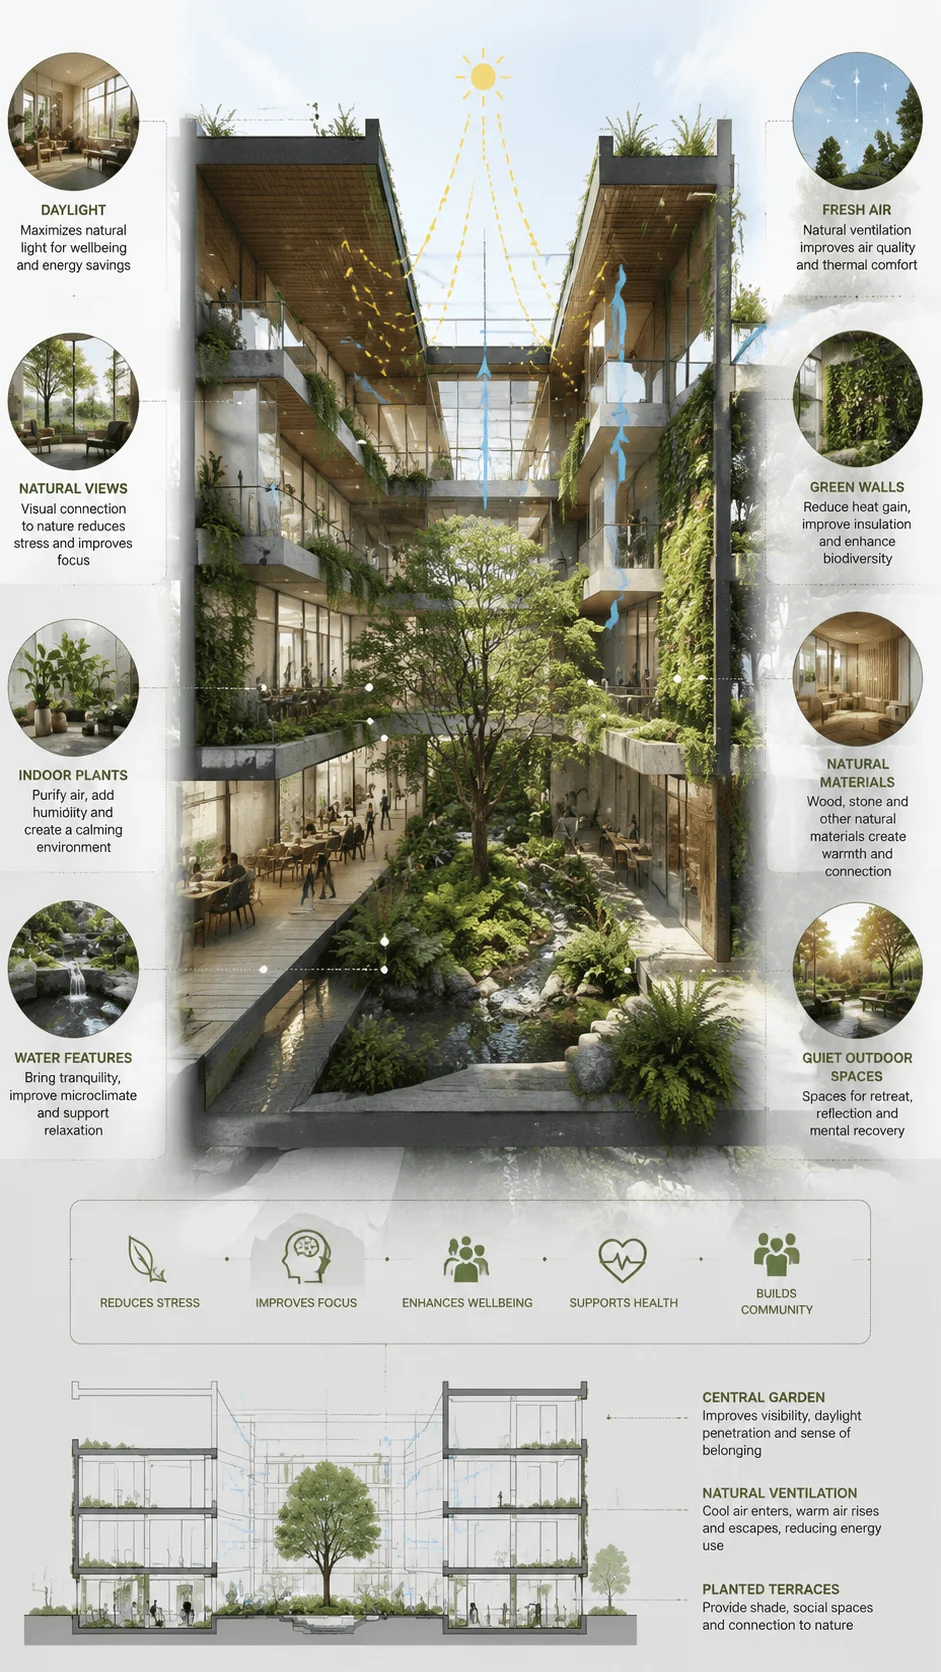
This topic works well because it connects sustainability with emotion. People do not only need efficient buildings. They need places that reduce stress, support focus, and create a sense of belonging. A diagram can show how a central garden improves visibility, how natural ventilation brings fresh air, and how planted terraces create social spaces. In sustainability concept diagram architecture, these natural links should support comfort and climate performance.
Sponge Building and Water Cycle Diagram
Water sensitive architecture has become a major design direction, especially in cities that face flooding, heat, and water shortage. A sponge building diagram shows how a project absorbs, stores, filters, and reuses water. This idea can make your article feel current and practical.
The diagram can include green roofs, rain gardens, bioswales, permeable paving, greywater reuse, storage tanks, planted courtyards, and shaded water edges. It can show rain falling on the roof, moving through channels, entering storage, watering plants, and returning safely into the ground.
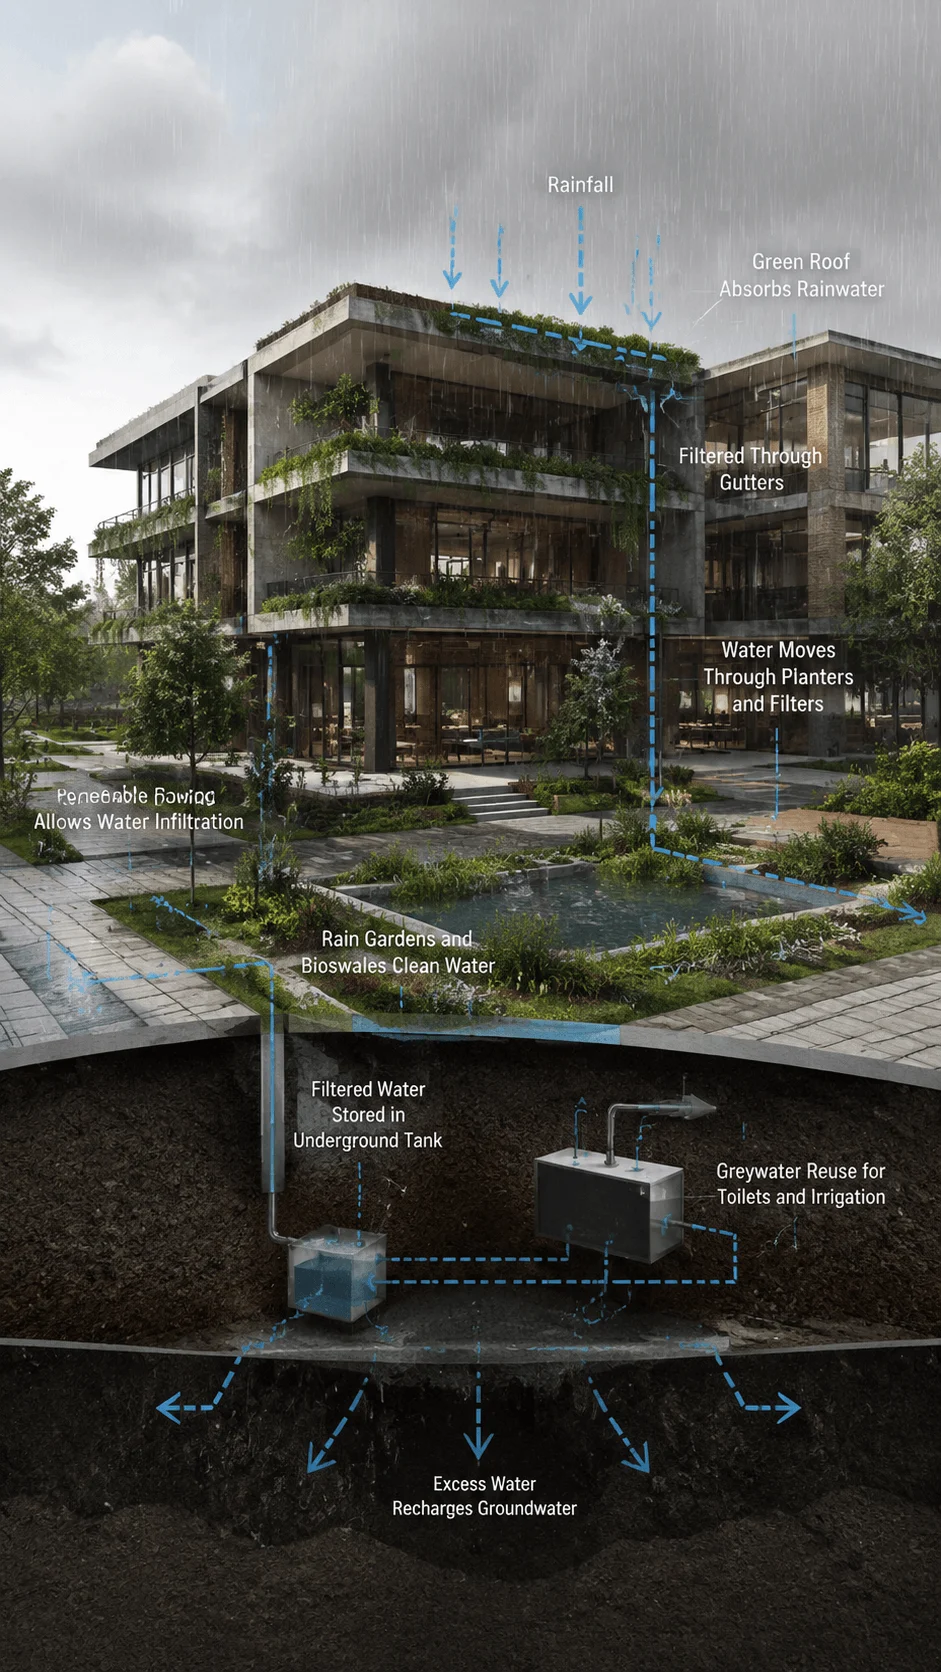
This idea also connects architecture with urban resilience. A building should not simply push stormwater into drains. It can slow water down, clean it, and use it. A sponge diagram explains how design reduces flood pressure while improving landscape quality.
Adaptive Reuse and Sustainable Building Concept Diagram
Adaptive reuse means giving an existing building a new life. It is one of the most responsible design strategies because it saves embodied carbon, reduces demolition waste, preserves cultural memory, and supports urban renewal. A sustainable building concept diagram for adaptive reuse can compare what stays, what changes, and what improves.
The diagram can show the retained structure, upgraded envelope, new circulation, improved daylight, added insulation, reused materials, and new public spaces. It can also show the difference between demolition and reuse. This gives readers a clear way to understand why keeping a building can be more sustainable than replacing it.
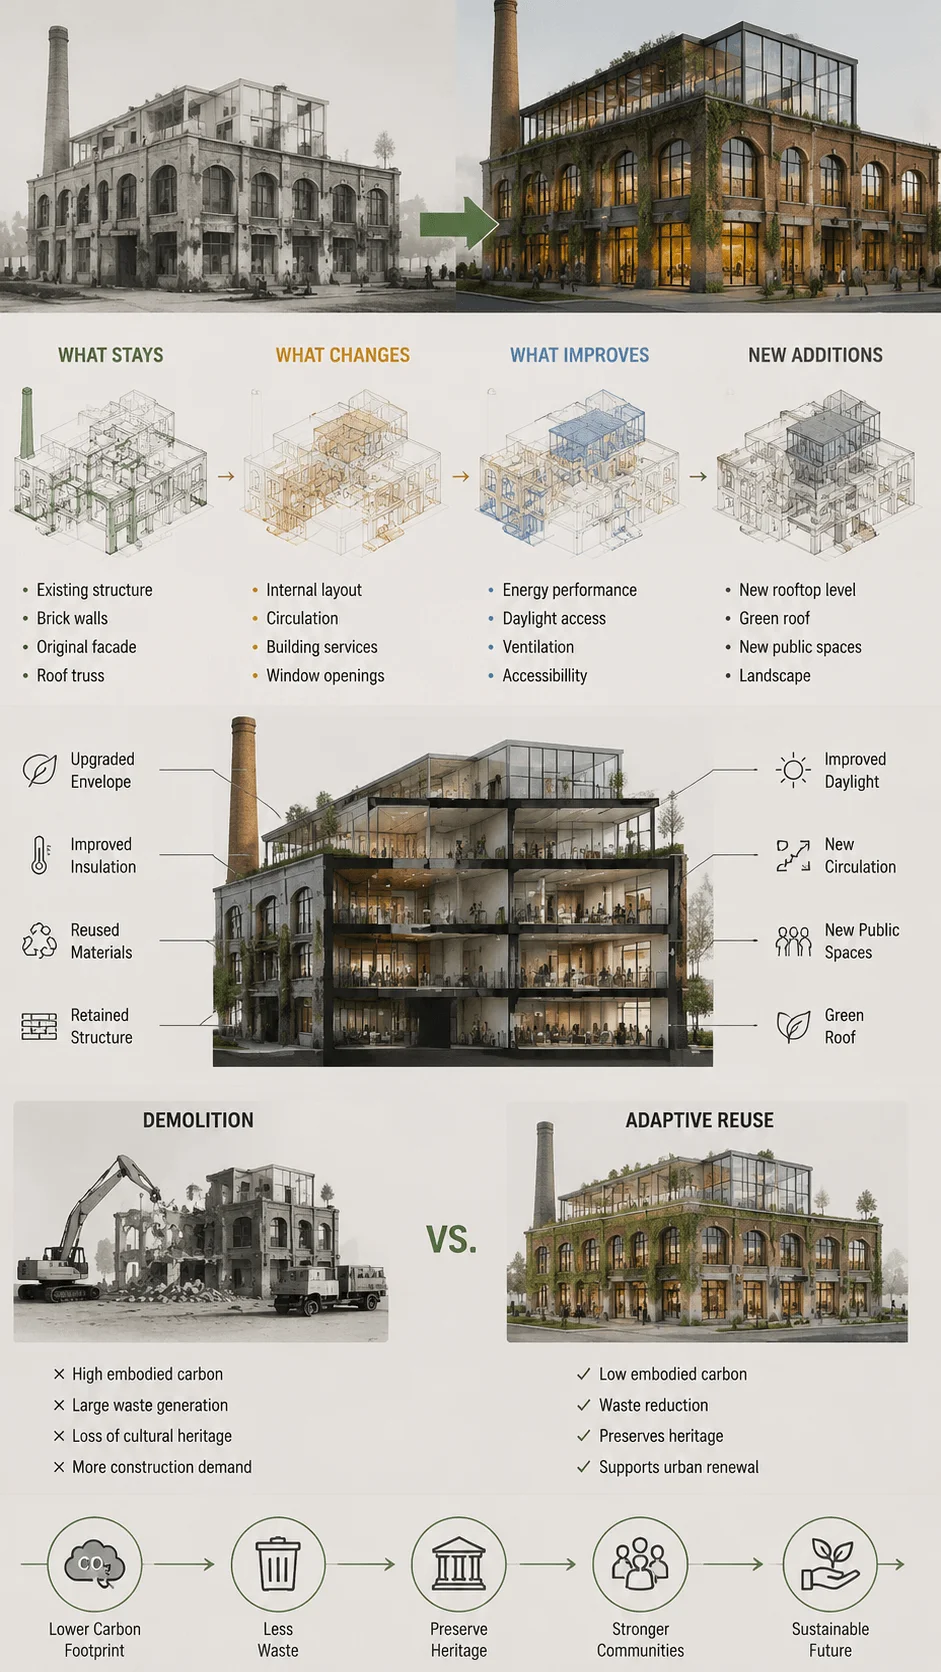
Adaptive reuse also adds emotional value. Old buildings often carry stories, textures, and memories that new buildings cannot easily create. A diagram can show this by layering old and new elements.
Climate Responsive Architecture Diagram
A climate responsive architecture diagram shows how design reacts to sun, wind, rain, temperature, and seasonal change. This type of diagram should appear in almost every article about sustainable design because climate response forms the foundation of green architecture.
The diagram can show sun paths, shaded facades, wind arrows, cross ventilation, thermal mass, roof overhangs, courtyards, vegetation, and orientation. It should answer one simple question. How does the building use the climate instead of fighting it?
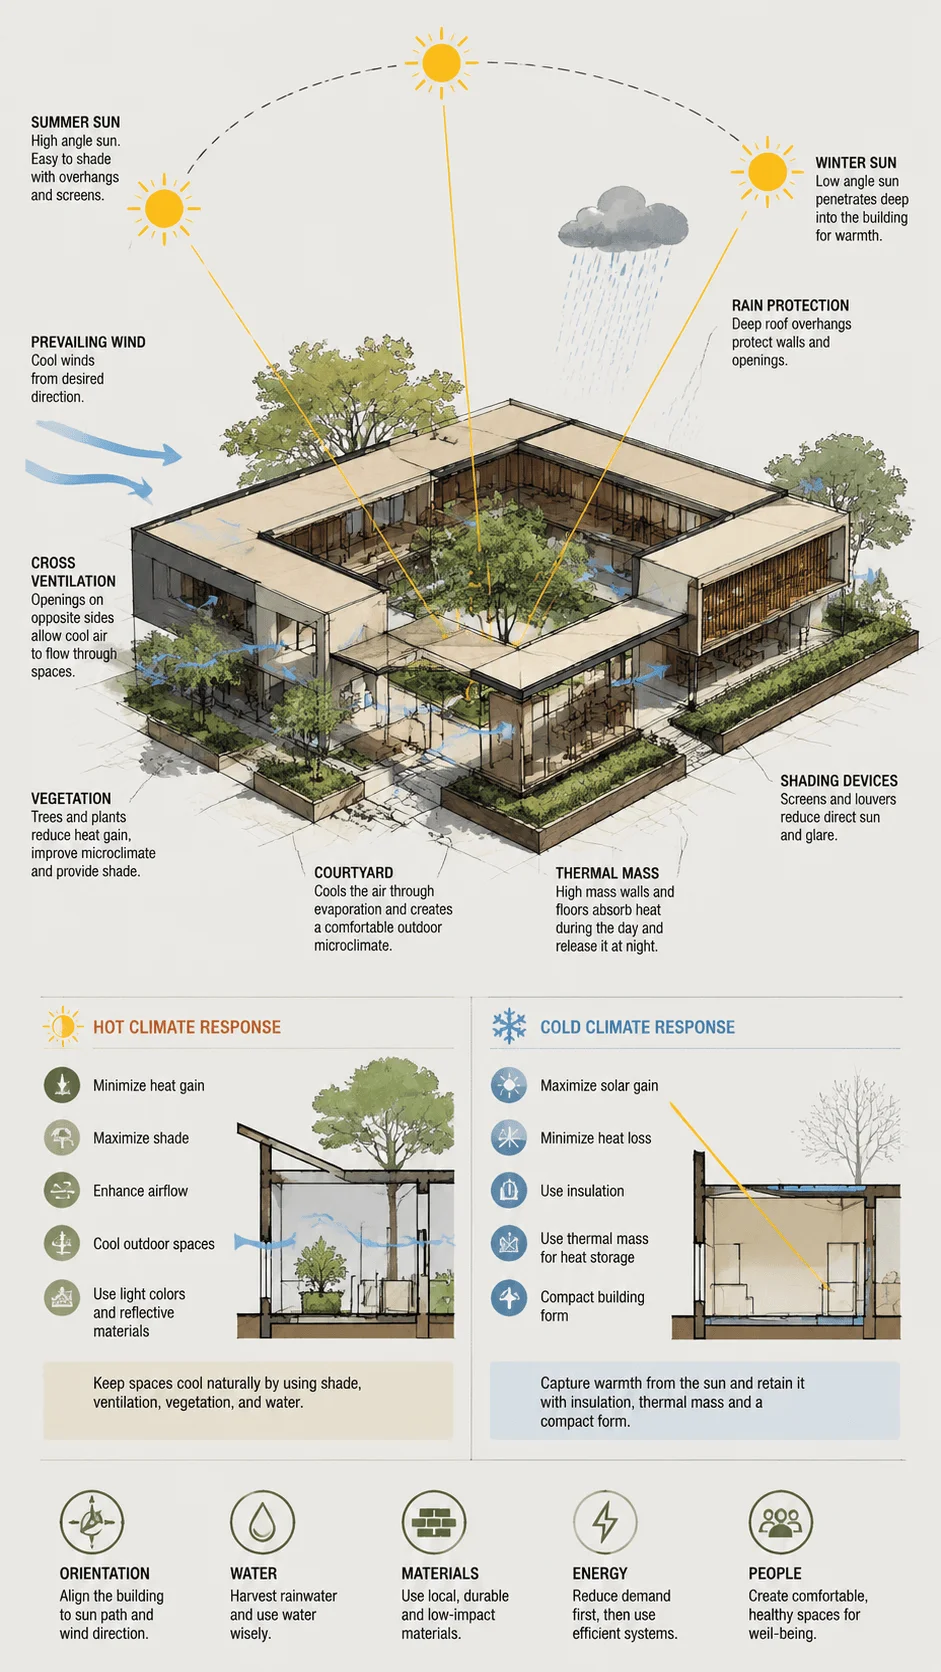
In hot regions, the diagram may show deep shade, narrow openings on harsh sides, courtyards that cool air, and planted buffers that reduce heat. In colder regions, it may show sun facing glazing, compact form, insulation, and heat storage. This is why sustainability concept diagram architecture needs site awareness, not only green technology.
Biodiversity Positive Building Diagram
A biodiversity positive building supports plants, insects, birds, soil, and small habitats. It does not treat landscape as decoration. It treats landscape as a living network. This is a strong modern topic because cities need more ecological repair.
A biodiversity diagram can show native planting, pollinator gardens, green roofs, bird friendly facades, soil zones, water habitats, and connected green corridors. It can also show how the building avoids harming local species. For example, a diagram can explain how lighting stays low near habitat areas and how roof gardens support insects.
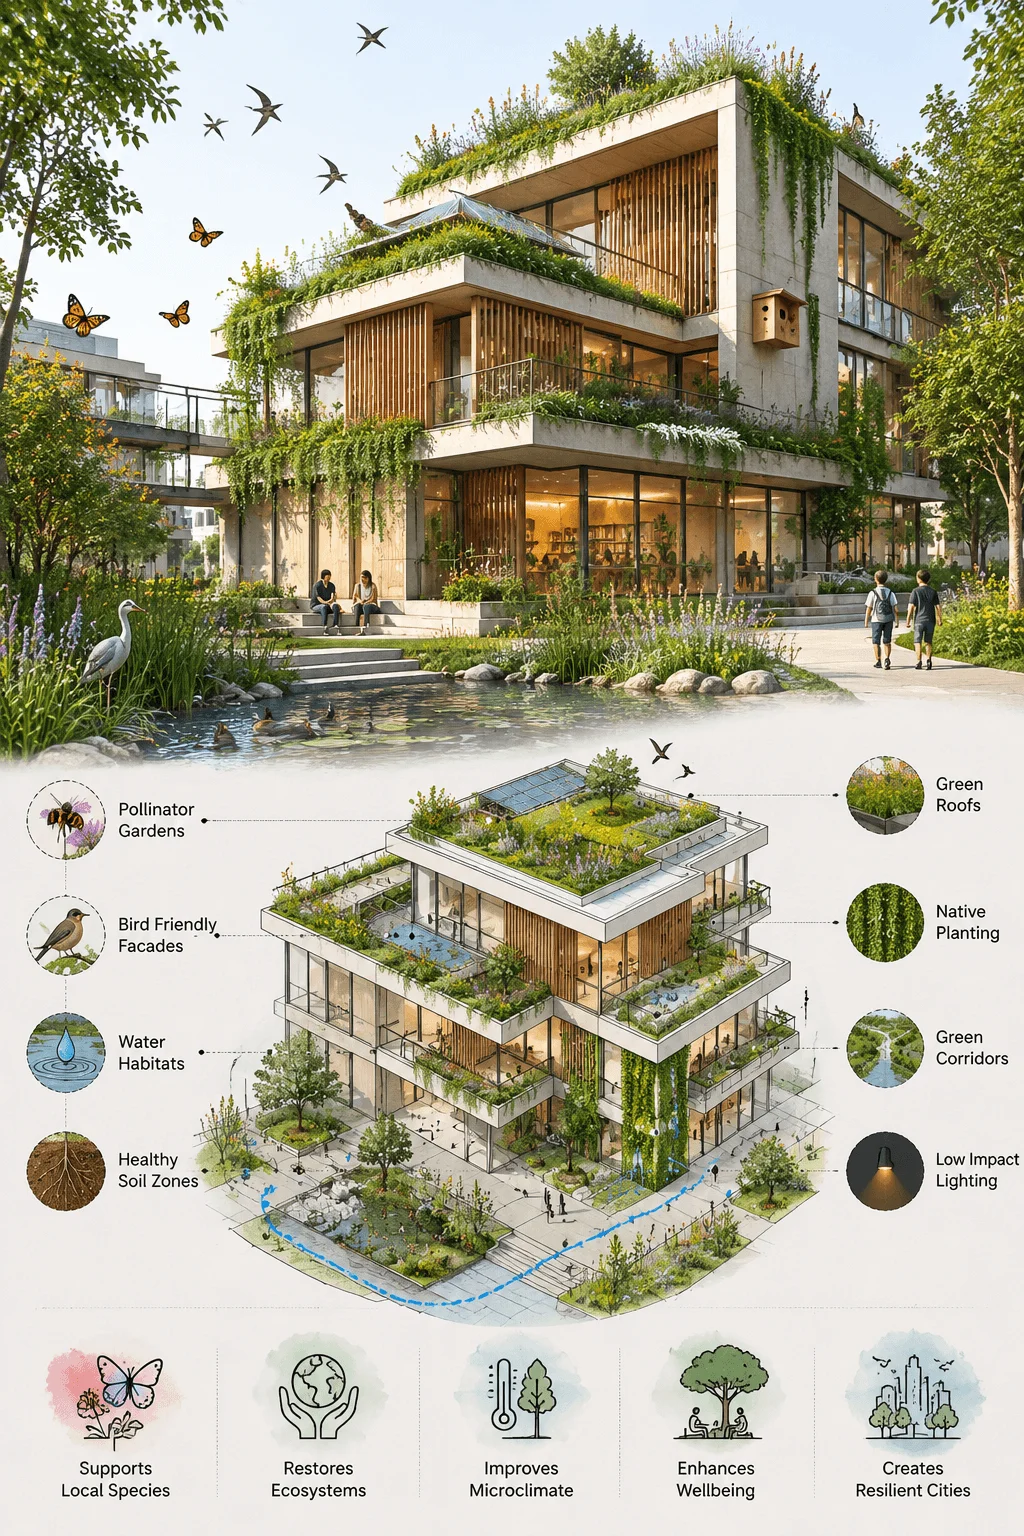
This type of green architecture concept diagram helps readers understand that sustainability includes life beyond humans. A building can create shelter, food, shade, and movement paths for other species. When architecture supports biodiversity, it becomes part of a healthier urban ecosystem.
AI Assisted Sustainability Analysis Diagram
AI assisted design and environmental simulation are becoming popular in architecture. Designers now use digital tools to test daylight, energy, airflow, carbon, solar exposure, and comfort before they finalize a design. An AI assisted sustainability diagram can show how data shapes decisions.
The diagram can begin with site information, climate data, building options, simulation results, and final design improvements. It can show how one design version receives too much heat while another improves shade and daylight. This makes the design process transparent.
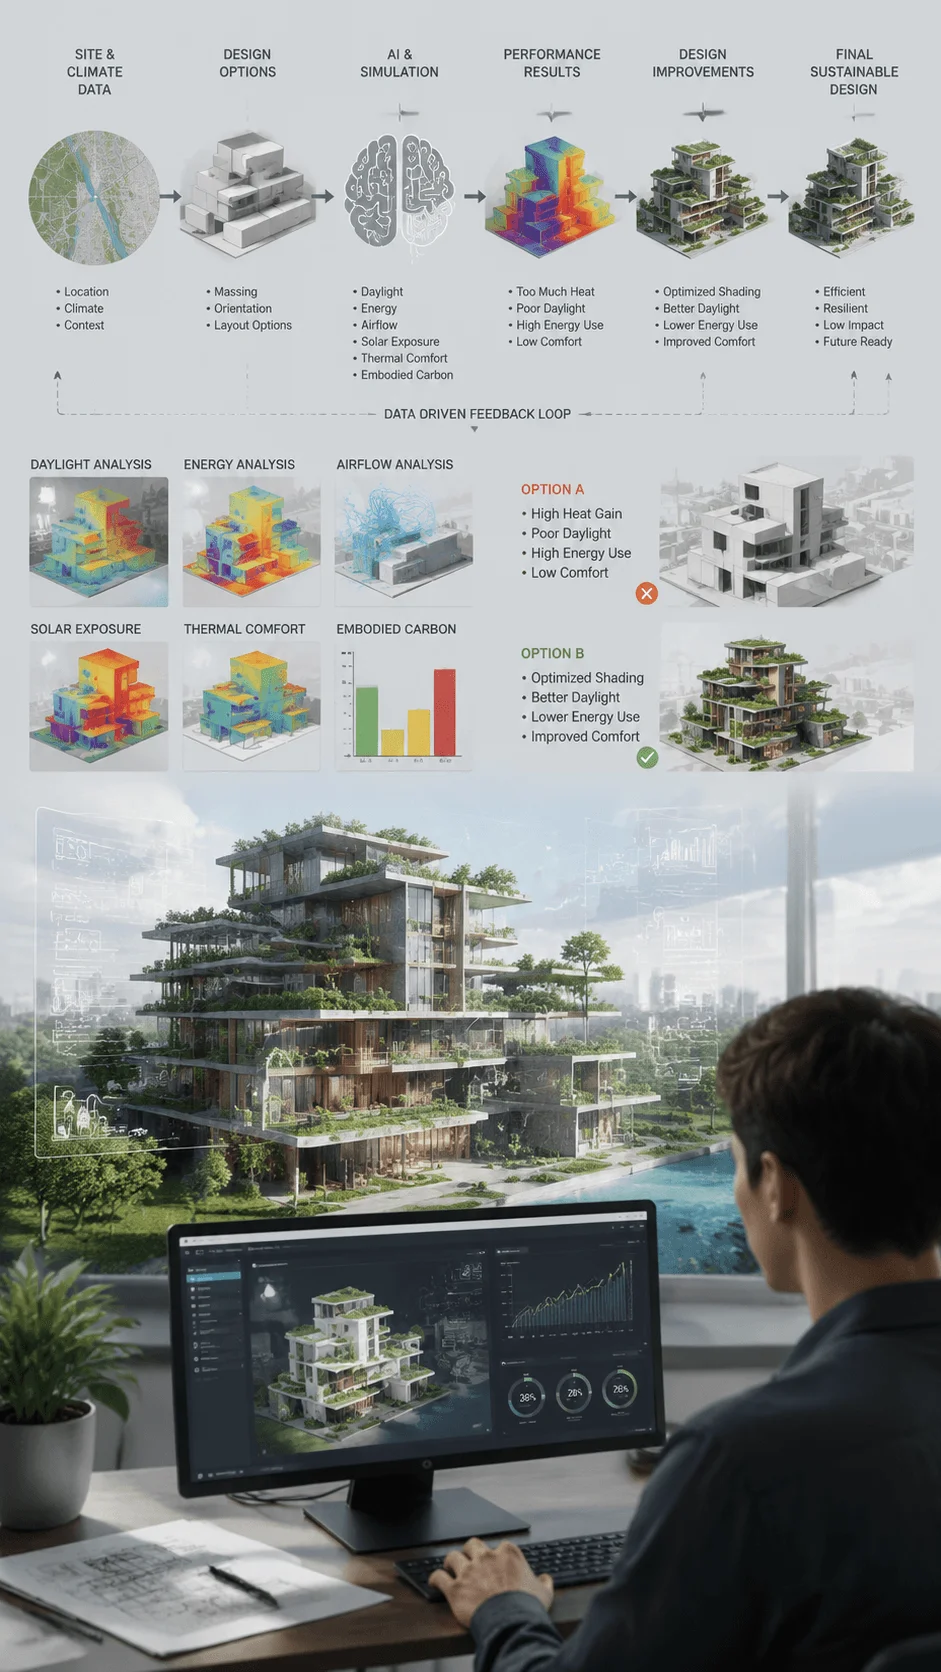
This topic gives sustainability concept diagram architecture a future focused angle. Diagrams can explain design evolution and show how evidence guides modern sustainable architecture.
Community Centered Sustainability Diagram
Sustainability also includes people. A community centered sustainability diagram can show shared spaces, public access, safe movement, local services, social interaction, inclusive design, and cultural identity. This helps your article move beyond energy and materials.
A strong diagram can show how a building welcomes people from the street, where community activities happen, how outdoor shaded spaces support gathering, and how accessible routes connect different users. It can also show links to local transport, markets, schools, parks, or public services.
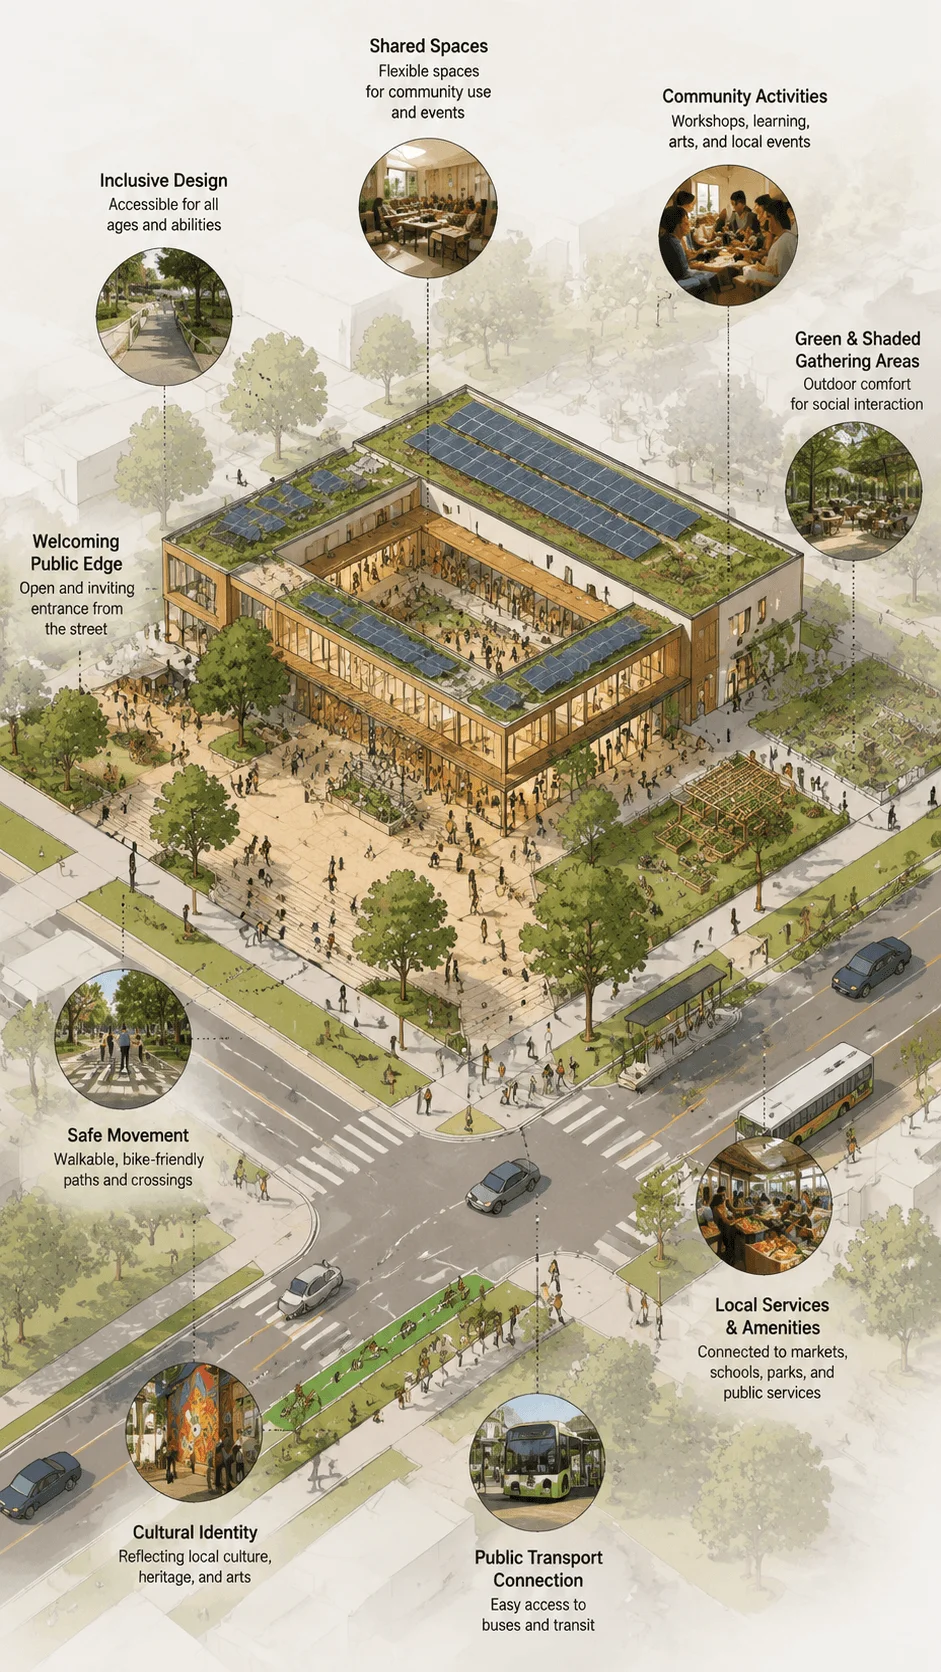
This idea matters because a building that saves energy but ignores people cannot become truly sustainable. Architecture should support daily life. It should help communities feel safe, connected, and respected.
Local Material Based Architecture Diagram
Local material design connects sustainability with place. It reduces transport impact, supports craft, responds to climate, and gives buildings a stronger identity. A local material diagram can show where materials come from and how they fit the climate.
The diagram can include earth, stone, bamboo, timber, clay, lime, recycled brick, or other regionally available resources. It can also show traditional strategies such as shaded courtyards, thick walls, verandas, screens, and natural ventilation.
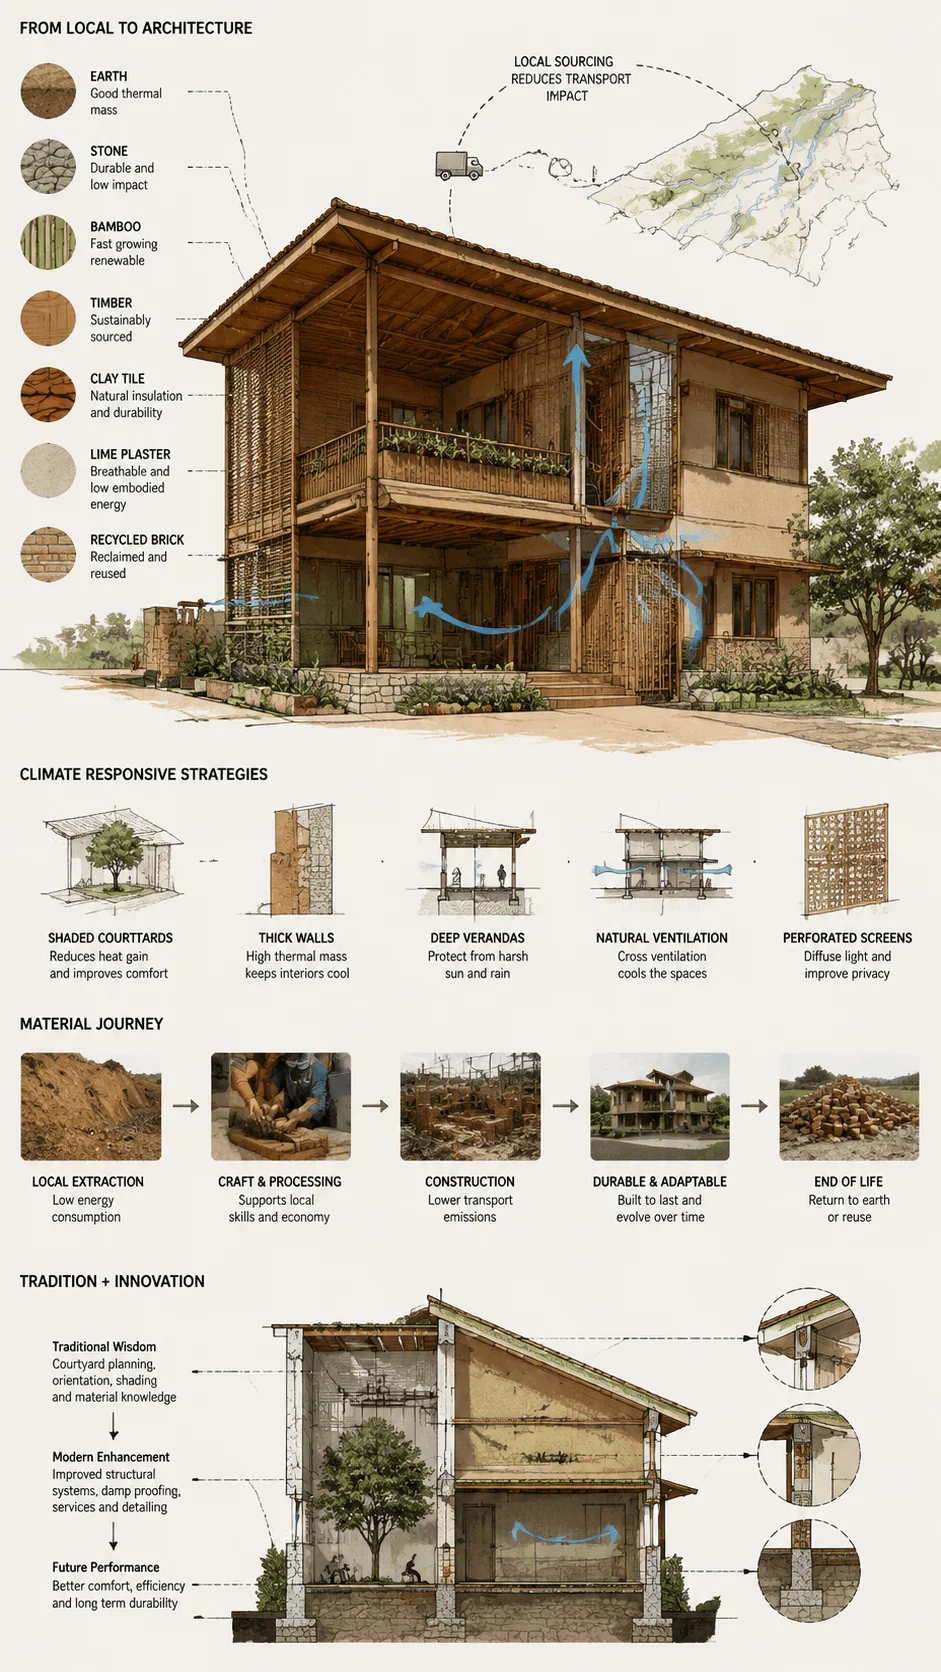
In sustainability concept diagram architecture, local material thinking can connect past knowledge with future performance. A diagram can show that old climate wisdom still matters and how modern detailing improves durability, comfort, and safety.
How to Create a Strong Sustainability Diagram
A strong diagram begins with one clear message. Do not place every sustainable feature into one crowded image. Decide what the diagram needs to explain. It may focus on energy, water, materials, carbon, biodiversity, comfort, or community. Once the idea becomes clear, every arrow and label should support it.
Use layers to organize information. The site layer can show climate and context. The building layer can show form and spaces. The system layer can show water, energy, or material flows. The human layer can show movement, comfort, and social use. This layered approach helps readers follow the logic without confusion.
Use simple icons and readable labels. Arrows should show direction and cause. Colors should carry meaning. Blue can represent water, yellow can represent sunlight, green can represent ecology, and grey can represent structure. The diagram should feel clean, not decorative.
Conclusion
Sustainability concept diagram architecture has become an essential part of modern design communication because green buildings need clear visual explanations. A strong diagram can show how a building saves energy, manages water, reduces carbon, supports biodiversity, improves wellbeing, and respects community life. It helps architects move from vague claims to visible design logic.
The future of sustainability concept diagram architecture depends on systems thinking. Buildings must work with climate, materials, ecology, technology, and people at the same time. Concept diagrams help organize this complexity. They allow students, designers, clients, and communities to understand why a project matters and how it performs.
A good sustainable diagram does not simply show green features. It tells the story of responsible design. It explains how each decision connects to a larger environmental and social purpose. As architecture faces climate change and resource pressure, sustainability concept diagram architecture will continue to guide better buildings, smarter cities, and more thoughtful design futures.